

Most of the securities traded in the capital market remain within a range about 80% of the time, with occasional trends upwards or downwards during the remaining 20%. When security breaks out of this range with high trading volume, it presents an excellent buying or selling opportunity. Range breakout trading systems, combined with effective money management, have long been recognized as valuable and profitable tools in the world of technical analysis. This Excel sheet serves as an illustration of one such range breakout setup, originally devised by Sir Tony Grabel.
You can find the AFL code for this strategy here.
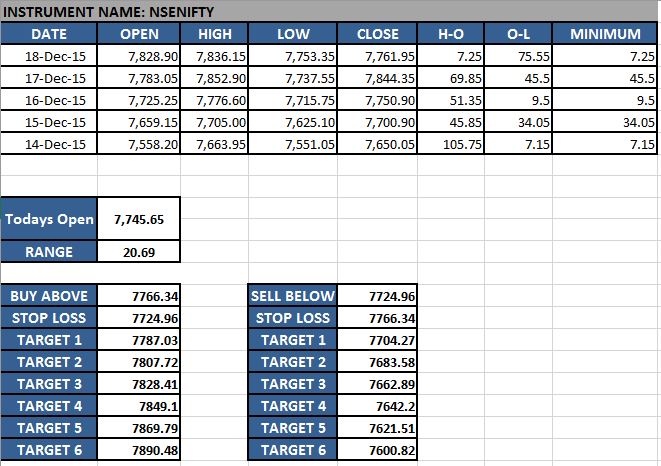
According to this range breakout method, a trade should be initiated when the price moves above or below the sum of the current day’s opening price and the five-day average price range.
- Buy Logic: Current Price > Open Price + Average price range of the last 5 days
- Sell Logic: Current Price < Open Price – Average price range of the last 5 days
- Target and Stop Loss: As indicated in the Excel Sheet
Read Also: Excel-Based Moving Average Trading System
Worksheet Name:
Breakout Trading
Inputs:
- DATE, OPEN, HIGH, LOW, CLOSE: Open, High, Low, Close values of the last five days for the selected security.
- Today’s Open: Today’s opening price in the market.
Outputs:
- RANGE: Average price range of the last 5 days.
- BUY ABOVE: The system signals a buy when the price crosses above this value.
- SELL BELOW: The system signals a sell when the price crosses below this value.
- TARGET 1, 2, 3, 4, 5, 6: Different profit booking targets based on your money management rules. It’s advisable to book partial profit at each target level.
- STOP LOSS: The price level at which you should exit the trade if it goes in the opposite direction.
Download the Excel Sheet for Trading Range Breakouts on Daily Timeframe
We have extensively tested this trading system on various securities and found it to be highly profitable, especially with liquid stocks and indices like Nifty, Banknifty, SBI, ITC, etc. These securities typically have a high average trading volume compared to others. Variations of this strategy for intraday trading are also in development, and we plan to share them in the future. Feel free to download the Excel sheet and explore this strategy on your own. If you have any questions, please don’t hesitate to ask.
Read Also: Price Action Trading!


3 Comments