
One effective strategy to profit in the financial markets is to follow the trend. It’s critical to select the right technical tools that provide clear guidance to those who trade with the trend. The Guppy Multiple Moving Average (GMMA) stands out as a highly reliable tool for identifying current trends and potential reversals. This tool was crafted by Daryl Guppy, an Australian trader who dedicated years to perfect this indicator. We’ll take a look at a trading system built around the GMMA in this article, complete with AFL code, trading signals, and results from past tests.

Understanding the Guppy Multiple Moving Average Strategy

The GMMA brings together two groups of exponential moving averages (EMAs): one group for shorter periods like 3, 5, 8, 12, and 15, and another for longer periods such as 30, 35, 40, 45, and 50. When the short-term EMAs climb above the long-term EMAs, it’s a sign of an uptrend; conversely, when they fall below, a downtrend is likely. These crossing points signal a shift in trend. Remember, the periods of the EMAs can be adjusted to fit your strategy.

Short-term EMAs reflect the actions of traders who hold positions for a brief time, while long-term EMAs reveal the behavior of those who invest over longer periods. This makes the GMMA a clever way to sense the mood of the market. It shines when applied to stocks with a clear direction but can be less reliable for those that move sideways. Therefore, it’s best to use it selectively.

Our testing of the GMMA-based system on the volatile and trend-prone Banknifty and Nifty indices shows impressive and consistent results over the past decade.

Click here to dive into AFL coding and develop your trading systems.

Overview of the Guppy Multiple Moving Average AFL

ParameterValue
Preferred Time-frame
Daily
Indicators UsedEMA (Exponential Moving Average)
Buy ConditionAverage of (difference between shorter timeframe moving averages and longer timeframe moving averages) aka FastGuppy crosses the smoothed average of FastGuppy from bottom
Short ConditionAverage of (difference between shorter timeframe moving averages and longer timeframe moving averages) aka FastGuppy crosses the smoothed average of FastGuppy from top
Sell Condition
  • Same as Short
  • Stop Loss Hit
  • Target met
Cover Condition
  • Same as Buy
  • Stop Loss Hit
  • Target met
Stop Loss1%
Targets5%
Position Size10% of Equity
Initial Equity200000
Brokerage100 per order
Margin10%

GMMA Trading System – AFL Code

				
					//------------------------------------------------------
//
//  Formula Name:    Guppy multiple moving average Trading system
//  Website:         https://zerobrokerageclub.com/
//------------------------------------------------------

_SECTION_BEGIN("Guppy multiple moving average Trading system");

SetBarsRequired( sbrAll );
SetChartOptions(0,chartShowArrows|chartShowDates);

//Initial parameters
SetTradeDelays( 1,1,1,1 );
SetOption( "InitialEquity", 200000);
SetOption("FuturesMode" ,True);
SetOption("MinShares",1);
SetOption("CommissionMode",2);
SetOption("CommissionAmount",100);
SetOption("AccountMargin",10);
SetOption("RefreshWhenCompleted",True);
SetPositionSize(10,spsPercentOfEquity);
SetOption( "AllowPositionShrinking", True );


Plot( Close, "Price",colorWhite, styleCandle );

guppy0= ema( close, 3 );
guppy1= ema( close, 5 );
guppy2= ema( close, 8 );
guppy3 = ema( close, 12 );
guppy4 = ema( close, 15 );

g1 = (guppy0+guppy1+guppy2+guppy3+guppy4)/5;

guppy5= ema( close, 30 );
guppy6= ema( close, 35 );
guppy7= ema( close, 40 );
guppy8 = ema( close, 45 );
guppy9 = ema( close, 50 );

g2 = (guppy5+guppy6+guppy7+guppy8+guppy9)/5;

SmoothFactor = param("smooth",5,5,50,1);

FastGuppy = g1-g2;
SlowGuppy = ema(FastGuppy, SmoothFactor);

Buy = Cross(FastGuppy,SlowGuppy);
Short = Cross(SlowGuppy,FastGuppy); 
Sell = Short;
Cover = Buy;

BuyPrice=Open;
SellPrice=Open;
ShortPrice=Open;
CoverPrice=Open;

Buy = ExRem(Buy,Sell);
Sell = ExRem(Sell,Buy);
Short=ExRem(Short,Cover);
Cover=ExRem(Cover,Short);

printf("\nBuy : " + Buy );  
printf("\nSell : " + Sell );  
printf("\nShort : " + Short );  
printf("\nCover : " + Cover );  
printf("\nDoji : " + abs(O-C) ); 

StopLoss=param("SL",1,1,10,1);
Target=param("Target",5,5,40,5);
ApplyStop(Type=0,Mode=1,Amount=StopLoss);
ApplyStop(Type=1,Mode=1,Amount=Target);
 
PlotShapes(IIf(Buy, shapeSquare, shapeNone),colorGreen, 0, L, Offset=-40);
PlotShapes(IIf(Buy, shapeSquare, shapeNone),colorLime, 0,L, Offset=-50);
PlotShapes(IIf(Buy, shapeUpArrow, shapeNone),colorWhite, 0,L, Offset=-45);
PlotShapes(IIf(Cover, shapeSquare, shapeNone),colorGreen, 0, L, Offset=-40);
PlotShapes(IIf(Cover, shapeSquare, shapeNone),colorLime, 0,L, Offset=-50);
PlotShapes(IIf(Cover, shapeUpArrow, shapeNone),colorWhite, 0,L, Offset=-45);
PlotShapes(IIf(Sell, shapeSquare, shapeNone),colorRed, 0, H, Offset=40);
PlotShapes(IIf(Sell, shapeSquare, shapeNone),colorOrange, 0,H, Offset=50);
PlotShapes(IIf(Sell, shapeDownArrow, shapeNone),colorWhite, 0,H, Offset=-45);
PlotShapes(IIf(Short, shapeSquare, shapeNone),colorRed, 0, H, Offset=40);
PlotShapes(IIf(Short, shapeSquare, shapeNone),colorOrange, 0,H, Offset=50);
PlotShapes(IIf(Short, shapeDownArrow, shapeNone),colorWhite, 0,H, Offset=-45);

_SECTION_END();


GMMA Trading System – Screenshot

Guppy-Multiple-Moving-Average Also, discover: McGinely Dynamic Trading System

Performance Review of the Guppy Multiple Moving Average Strategy

ParameterValue
Nifty and Banknifty
Initial Capital200000
Final Capital5993117.09
Scrip NameNSE Nifty and NSE Banknifty
Backtest Period05-Apr-2000 to 25-Sep-2018
TimeframeDaily
Net Profit %2896.56%
Annual Return %19.89%
Number of Trades1091
Winning Trade %33.64%
Average holding Period4.70 periods
Max consecutive losses14
Max system % drawdown-24.62%
Max Trade % drawdown-81.96%

Access the complete backtest report here.

Visual of Profit Growth

This system has experienced temporary downturns but has consistently bounced back.

GMMA_Equity_Curve

Display of Earnings

GMMA_Profit_TableAdditional Settings for Amibroker Backtesting

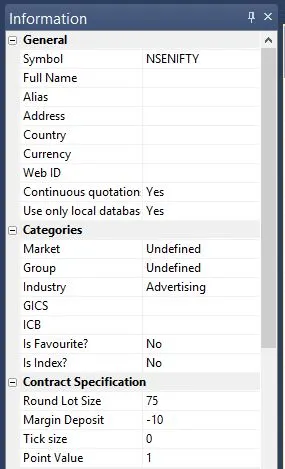
For setting up in Amibroker, navigate to Symbol–>Information, and enter the details for lot size and margin. The image below shows a lot size of 75 and a margin requirement of 10% for NSE Nifty, with similar settings for Banknifty:

Symbol-Info_Nifty

Leave a Reply