
Exploring the McGinley Dynamic Trading System

Discover the McGinley Dynamic Trading System, developed by John R. McGinley. It’s recognized as Investopedia’s most reliable indicator, offering unique advantages over traditional moving averages.

The McGinley Dynamic Indicator 

Compared to simple and exponential moving averages, the McGinley Dynamic is highly responsive to raw data. It’s designed to minimize whipsaws and closely track prices, outperforming conventional moving averages.

Formula for the McGinley Dynamic Indicator

MD = MD-1 + (Price – MD-1) / (N * (Price / MD-1) 4

MD-1: Indicator value for the previous candle or bar

Price: Price of the security

N: Smoothing factor

For more on AFL coding and creating your own trading systems, visit this link.

McGinley Dynamic Trading System – AFL Overview

ParameterValue
Preferred TimeframeMcGinley Dynamic
Indicators Used25-period McGinley Dynamic indicator
Buy Condition
  • Closing price crosses the McGinley Dynamic Line upwards
  • Current close is the highest in the last 3 bars
Short Condition
  • Closing price crosses the McGinley Dynamic Line downwards
  • Current close is the lowest in the last 3 bars
Sell Condition
  • Stop Loss triggered
  • Target met
  • Short condition met
Cover Condition
  • Stop Loss triggered
  • Target met
  • Buy condition met
Stop Loss10%
Targets40%
Position Size150 (fixed)
Initial Equity200,000
Brokerage100 per order
Margin10%

AFL Code

				
					//------------------------------------------------------
//
//  Formula Name:    Anti-Martingale Trading system
//  Website:        https://zerobrokerageclub.com/
//------------------------------------------------------

_SECTION_BEGIN("McGinley Dynamic Indicator");

SetBarsRequired( sbrAll );
SetChartOptions(0,chartShowArrows|chartShowDates);
_N(Title = StrFormat("{{NAME}} – {{INTERVAL}} {{DATE}} Open %g, Hi %g, Lo %g, Close %g (%.1f%%) {{VALUES}}", O, H, L, C, SelectedValue( ROC( C, 1 ) ) ));

//Initial Parameters
SetTradeDelays( 1,1,1, 1 );
SetOption( "InitialEquity", 200000);
SetOption("FuturesMode" ,True);
SetOption("MinShares",1);
SetOption("CommissionMode",2);
SetOption("CommissionAmount",100);
SetOption("AccountMargin",10);
SetOption("RefreshWhenCompleted",True);
//SetPositionSize(150,spsShares);
SetPositionSize(20,spsPercentOfEquity);
SetOption( "AllowPositionShrinking", True );


N = Param("McGinley Dynamic N ",25,5,40,5);
MD[0] = C[0];

for( i = 1; i < BarCount; i++ )
{
MD[ i ] = MD[ i - 1 ] + (C[i]-MD[i-1])/( N*(C[i] / MD[i-1])^4)  ;
}

Plot( Close, "Price",colorWhite, styleCandle );
Plot(MD,"McGinley Dynamic",colorYellow,1|styleThick);

Buy=C>MD AND C>Ref(C,-1) AND Ref(C,-1)>Ref(C,-2);
Short=C<MD AND C<Ref(C,-1) AND Ref(C,-1)<Ref(C,-2);;
Sell=Short;
Cover=Buy;

BuyPrice=Open;
SellPrice=Open;
ShortPrice=Open;
CoverPrice=Open;

Buy = ExRem(Buy,Sell);
Sell = ExRem(Sell,Buy);
Short=ExRem(Short,Cover);
Cover=ExRem(Cover,Short);

printf("\nBuy : " + Buy );  
printf("\nSell : " + Sell );  
printf("\nShort : " + Short );  
printf("\nCover : " + Cover );  

StopLoss=Param("SL",10,1,10,1);
Target=Param("Target",40,5,40,5);
ApplyStop(Type=0,Mode=1,Amount=StopLoss);
ApplyStop(Type=1,Mode=1,Amount=Target);

/* Plot Buy and Sell Signal Arrows */
PlotShapes(IIf(Buy, shapeSquare, shapeNone),colorGreen, 0, L, Offset=-40);
PlotShapes(IIf(Buy, shapeSquare, shapeNone),colorLime, 0,L, Offset=-50);
PlotShapes(IIf(Buy, shapeUpArrow, shapeNone),colorWhite, 0,L, Offset=-45);
PlotShapes(IIf(Cover, shapeSquare, shapeNone),colorGreen, 0, L, Offset=-40);
PlotShapes(IIf(Cover, shapeSquare, shapeNone),colorLime, 0,L, Offset=-50);
PlotShapes(IIf(Cover, shapeUpArrow, shapeNone),colorWhite, 0,L, Offset=-45);
PlotShapes(IIf(Sell, shapeSquare, shapeNone),colorRed, 0, H, Offset=40);
PlotShapes(IIf(Sell, shapeSquare, shapeNone),colorOrange, 0,H, Offset=50);
PlotShapes(IIf(Sell, shapeDownArrow, shapeNone),colorWhite, 0,H, Offset=-45);
PlotShapes(IIf(Short, shapeSquare, shapeNone),colorRed, 0, H, Offset=40);
PlotShapes(IIf(Short, shapeSquare, shapeNone),colorOrange, 0,H, Offset=50);
PlotShapes(IIf(Short, shapeDownArrow, shapeNone),colorWhite, 0,H, Offset=-45);

_SECTION_END();


AFL Screenshot

View the screenshot of the McGinley Dynamic Trading System for NSE Nifty below:

McGinley Dynamic Trading System

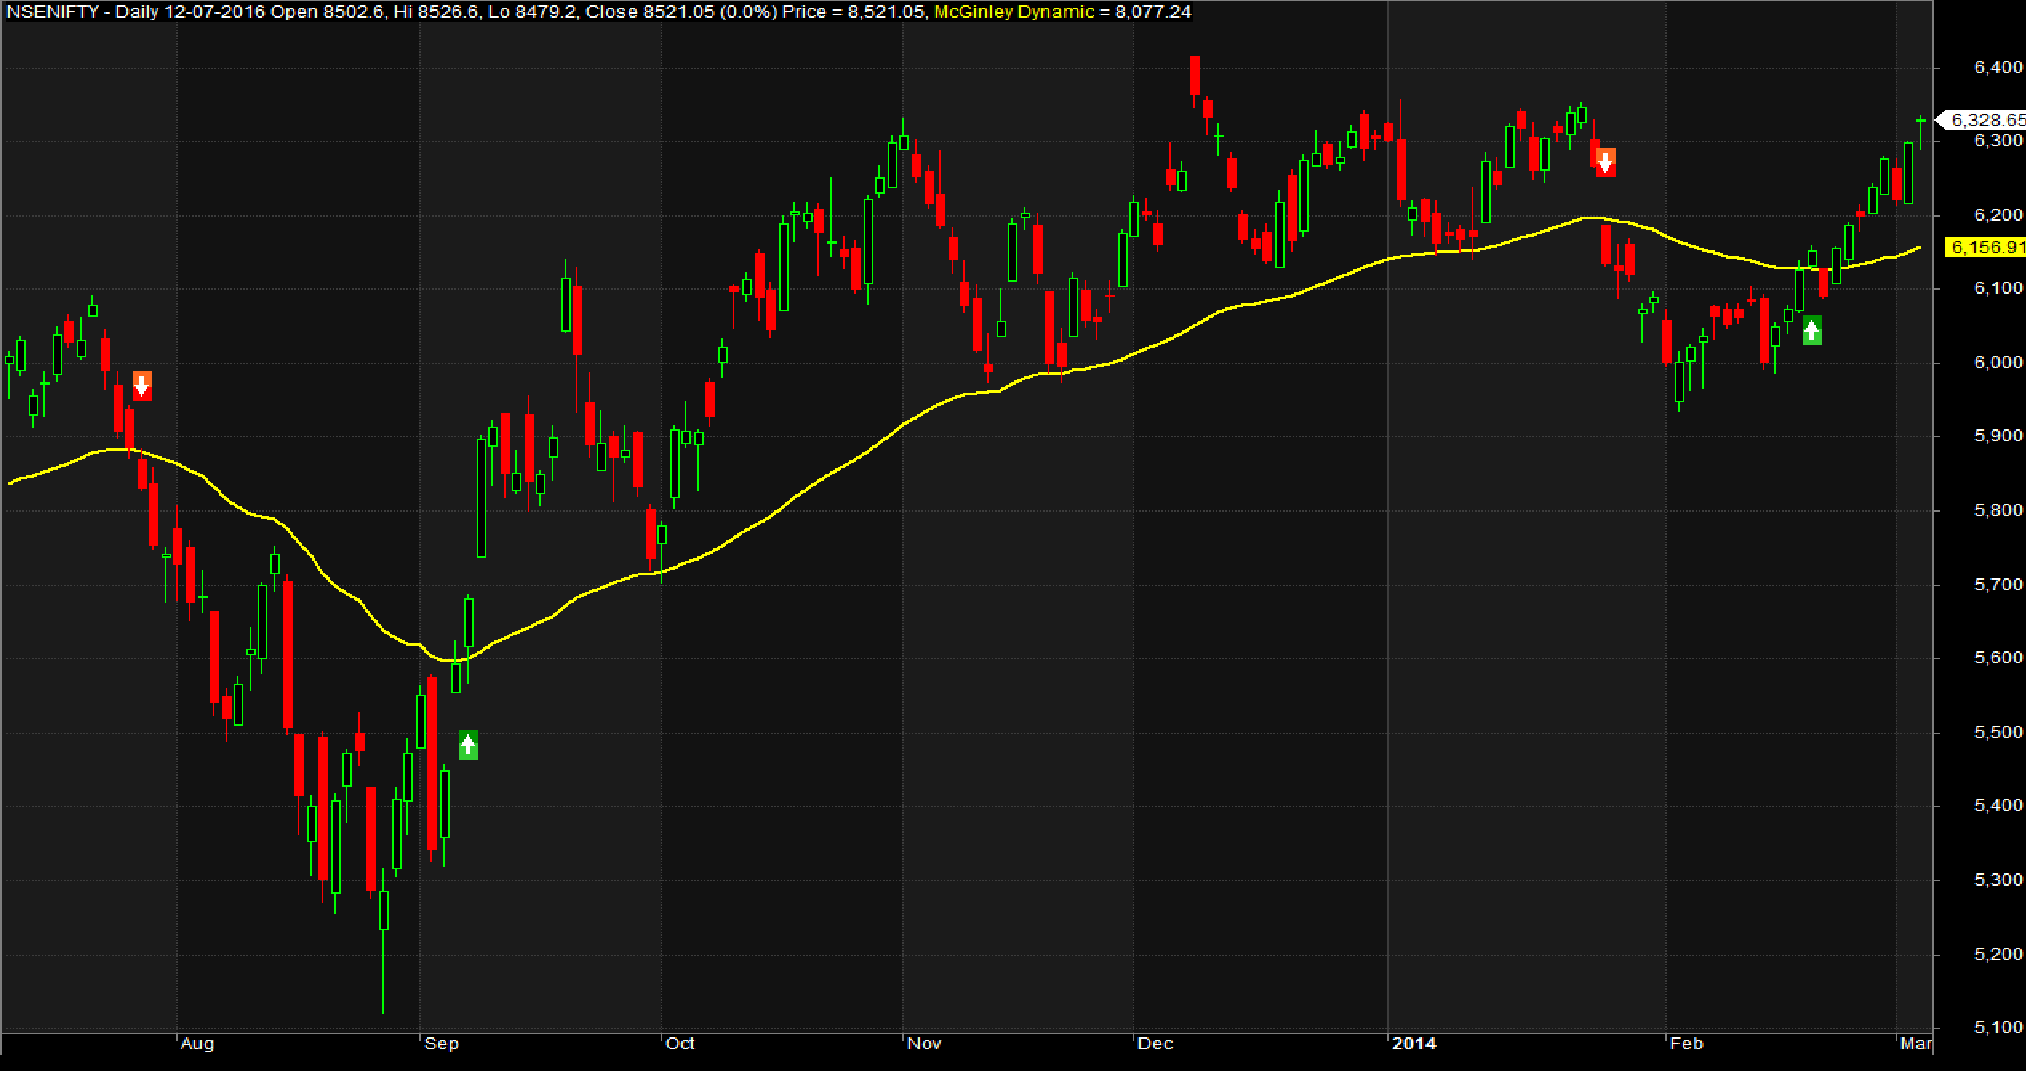
McGinley Dynamic Trading System – Backtest Report

This strategy has shown a respectable Compound Annual Growth Rate (CAGR) over the last 12 years, albeit with a slightly higher drawdown typical of trend-following strategies.

ParameterValue
NSE Nifty
Initial Capital200000
Final Capital1973764.04
Scrip NameNSE Nifty
Backtest Period01-Jan-2004 to 19-Oct-2016
TimeframeDaily
Net Profit %771.55%
Annual Return %18.42%
Number of Trades128
Winning Trade %36.72%
Average holding Period23.43 periods
Max consecutive losses9
Max system % drawdown-17.90%
Max Trade % drawdown-70.97%

For a detailed backtest report, download it here.

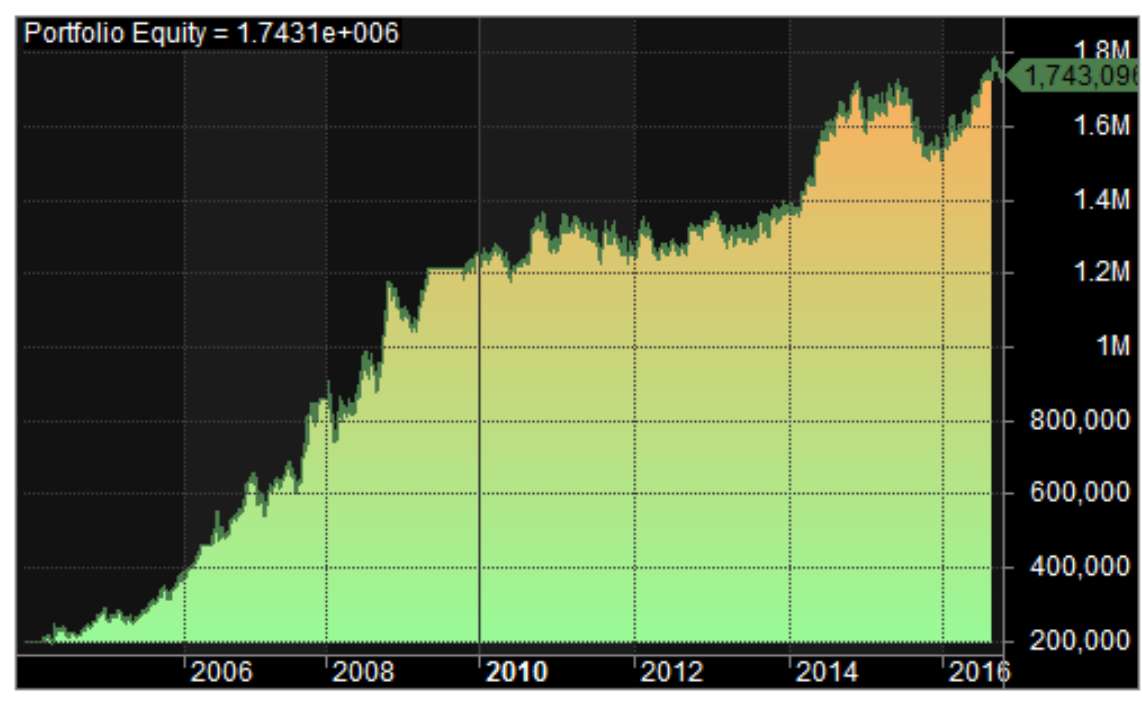
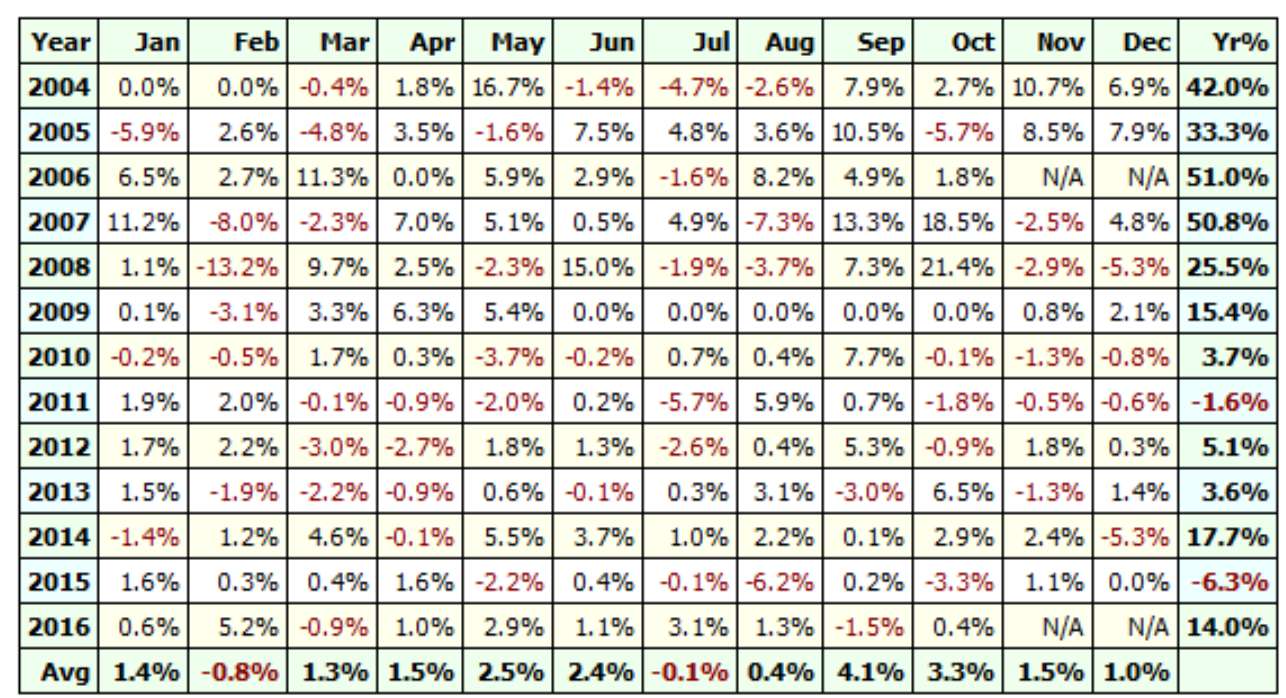
Equity Curve and Profit Table

Explore the equity curve and profit table for the McGinley Dynamic Trading System:

McGinley-Dynamic-Equity-Curve

McGinley-Dynamic-Profit-Table

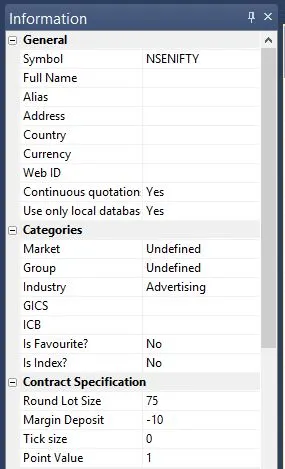
Additional Amibroker Settings for Backtesting

To optimize your backtesting in Amibroker, visit Symbol–>Information, and specify the lot size and margin requirement. The screenshot below illustrates a lot size of 75 and a margin requirement of 10% for NSE Nifty: