The RMO (Rahul Mohindar Oscillator) is a widely used indicator for market direction. It’s particularly popular among Metastock traders for handling highly volatile instruments. In our efforts to create a robust trading system, we have designed and backtested the RMO Trading System in Amibroker. This system relies on a combination of moving averages to forecast price movements. The RMO indicator was originally developed by Mr. Rahul Mohindar, based in India. In addition to his trading and training roles, Mr. Mohindar is a panelist on both CNBC and CNN India. If you want to learn AFL coding and create your own trading systems, click here.

RMO Trading System – AFL Overview

Parameter Value
Preferred Time-frame Daily
Indicators Used Simple Moving Average, Exponential Moving Average
Buy Condition
  • Buy when SwingTrade2 crosses over SwingTrade3.
  • SwingTrade2 and SwingTrade3 are constructed using combinations of moving averages, with SwingTrade2 tracking medium-term trends and SwingTrade3 tracking long-term trends.
Short Condition
  • Short when SwingTrade3 crosses over SwingTrade2.
Sell Condition
  • Sell conditions are the same as short.
  • Also, sell when stop loss is hit or the target is met.
Cover Condition
  • Cover conditions are the same as buy.
  • Also, cover when stop loss is hit or the target is met.
Stop Loss 1%
Targets 5%
Position Size 50% of equity
Initial Equity 200,000
Brokerage 100 per order
Margin 10%

RMO Trading System– AFL Code

				
					//------------------------------------------------------
//
//  Formula Name:    RMO Trading System
//  Website:         https://zerobrokerageclub.com/
//------------------------------------------------------

_SECTION_BEGIN("RMO Trading System");

SetBarsRequired( sbrAll );
SetChartOptions(0,chartShowArrows|chartShowDates);
_N(Title = StrFormat("{{NAME}} – {{INTERVAL}} {{DATE}} Open %g, Hi %g, Lo %g, Close %g (%.1f%%) {{VALUES}}", O, H, L, C, SelectedValue( ROC( C, 1 ) ) ));

//Initial Parameters
SetTradeDelays( 1,1,1, 1 );
SetOption( "InitialEquity", 200000);
SetOption("FuturesMode" ,True);
SetOption("MinShares",1);
SetOption("CommissionMode",2);
SetOption("CommissionAmount",100);
SetOption("AccountMargin",10);
SetOption("RefreshWhenCompleted",True);
//SetPositionSize(150,spsShares);
SetPositionSize(50,spsPercentOfEquity);
SetOption( "AllowPositionShrinking", True );

Plot( Close, "Price", colorWhite, styleCandle );

SwingTrd1 = 100 * (Close - ((MA(C,2)+
MA(MA(C,2),2)+
MA(MA(MA(C,2),2),2) +
MA(MA(MA(MA(C,2),2),2),2) +
MA(MA(MA(MA(MA(C,2),2),2),2),2) +
MA(MA(MA(MA(MA(MA(C,2),2),2),2),2),2) +
MA(MA(MA(MA(MA(MA(MA(C,2),2),2),2),2),2),2)+
MA(MA(MA(MA(MA(MA(MA(MA(C,2),2),2),2),2),2),2),2)+
MA(MA(MA(MA(MA(MA(MA(MA(MA(C,2),2),2),2),2),2),2), 2),2)+
MA(MA(MA(MA(MA(MA(MA(MA(MA(MA(C,2),2),2),2),2),2), 2),2),2),2))/10))/(HHV(C,10)-LLV(C,10));
SwingTrd2=EMA(SwingTrd1,30);
SwingTrd3=EMA(SwingTrd2,30);
RMO= EMA(SwingTrd1,81);

Buy=Cross(SwingTrd2,SwingTrd3);
Short=Cross(SwingTrd3,SwingTrd2);
Sell=Short;
Cover=Buy;

BuyPrice=Open;
SellPrice=Open;
ShortPrice=Open;
CoverPrice=Open;

Buy = ExRem(Buy,Sell);
Sell = ExRem(Sell,Buy);
Short=ExRem(Short,Cover);
Cover=ExRem(Cover,Short);

StopLoss=Param("SL",1,1,10,1);
Target=Param("Target",5,5,40,5);
ApplyStop(Type=0,Mode=1,Amount=StopLoss);
ApplyStop(Type=1,Mode=1,Amount=Target);

/* Plot Buy and Sell Signal Arrows */
PlotShapes(IIf(Buy, shapeSquare, shapeNone),colorGreen, 0, L, Offset=-40);
PlotShapes(IIf(Buy, shapeSquare, shapeNone),colorLime, 0,L, Offset=-50);
PlotShapes(IIf(Buy, shapeUpArrow, shapeNone),colorWhite, 0,L, Offset=-45);
PlotShapes(IIf(Cover, shapeSquare, shapeNone),colorGreen, 0, L, Offset=-40);
PlotShapes(IIf(Cover, shapeSquare, shapeNone),colorLime, 0,L, Offset=-50);
PlotShapes(IIf(Cover, shapeUpArrow, shapeNone),colorWhite, 0,L, Offset=-45);
PlotShapes(IIf(Sell, shapeSquare, shapeNone),colorRed, 0, H, Offset=40);
PlotShapes(IIf(Sell, shapeSquare, shapeNone),colorOrange, 0,H, Offset=50);
PlotShapes(IIf(Sell, shapeDownArrow, shapeNone),colorWhite, 0,H, Offset=-45);
PlotShapes(IIf(Short, shapeSquare, shapeNone),colorRed, 0, H, Offset=40);
PlotShapes(IIf(Short, shapeSquare, shapeNone),colorOrange, 0,H, Offset=50);
PlotShapes(IIf(Short, shapeDownArrow, shapeNone),colorWhite, 0,H, Offset=-45);

_SECTION_END();


AFL Screenshot

RMO Trading System- Backtest Report

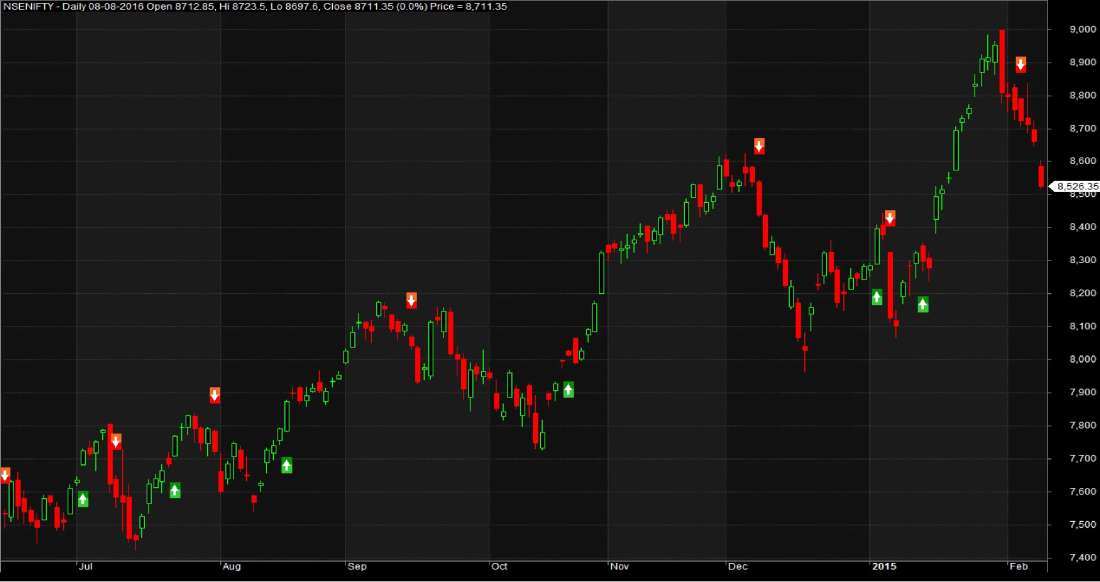
The RMO Trading system has shown remarkable profitability over the last 16 years. However, it’s important to note that the system also experiences significant drawdowns. For an inexperienced trader, dealing with 11 consecutive losses and a success ratio of less than 30% can be challenging.

ParameterValue
Nifty
Initial Capital200,000
Final Capital36,656,201.64
Scrip NameNSE Nifty
Backtest Period30-May-2000 to 12-Jan-2017
TimeframeDaily
Net Profit %18,228.10%
Annual Return %35.78%
Number of Trades335
Winning Trade %29.25%
Average Holding Period5.32 periods
Max Consecutive Losses11
Max System % Drawdown-70.78%
Max Trade % Drawdown-39.33%

Download the detailed backtest report here.
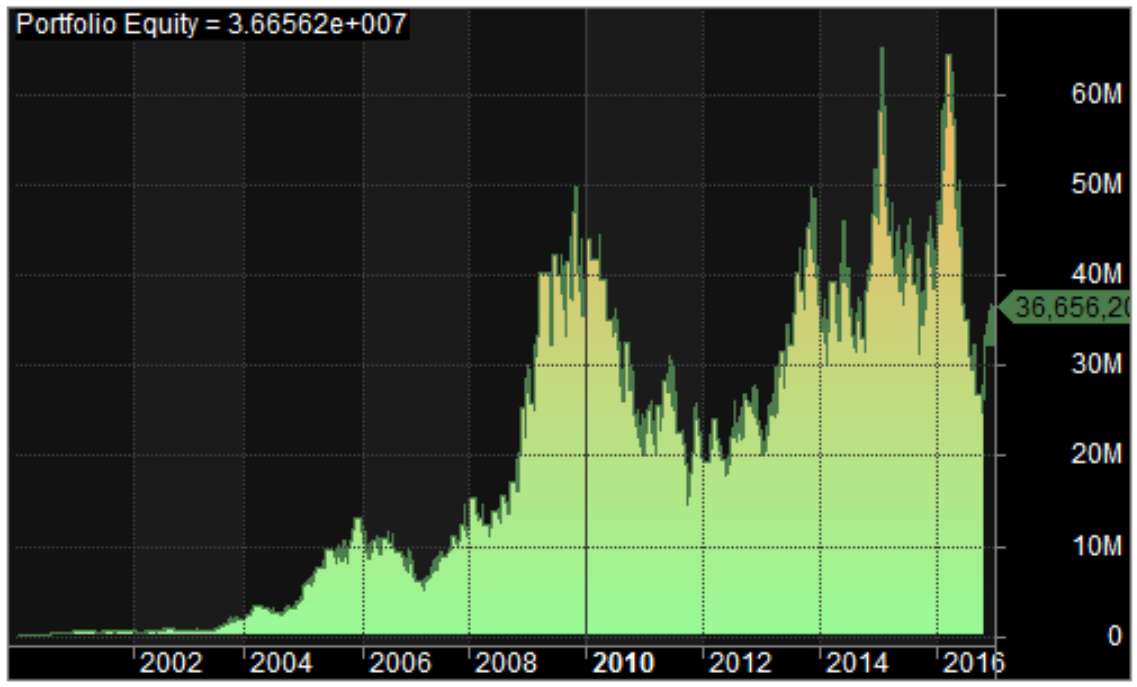
Equity Curve

The equity curve exhibits periods of significant drawdown, indicating its rough nature. Nevertheless, the system maintains overall profitability.
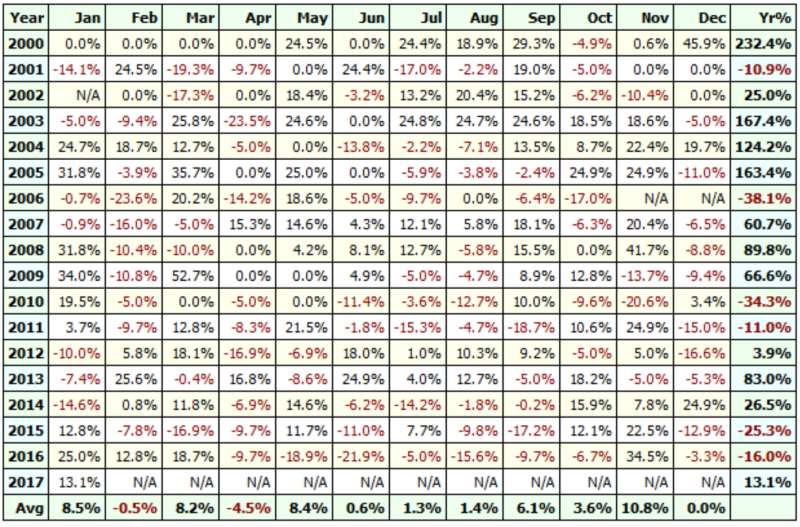
RMO-Trading-System-Equity-Curve

Profit Table

RMO-Trading-System-Profit-Table

Additional Amibroker Settings for Backtesting

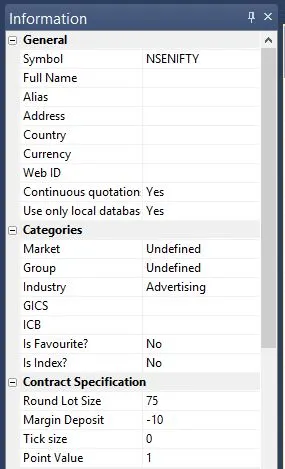
Go to Symbol –> Information and specify the lot size and margin requirement. The below screenshot illustrates a lot size of 75 and a margin requirement of 10% for NSE Nifty: