
Elder’s Force Index (EFI), an innovative oscillator, assesses the intensity of price movements in a specific direction. Developed by the renowned psychologist and trader Dr. Alexander Elder, it was first introduced in his bestseller Trading for a Living: Psychology, Trading Tactics, Money Management.
Elder suggests that price movements are driven by three core elements: direction, extent, and volume. The force index oscillator ingeniously merges these elements into a single indicator, providing precise market trend predictions.
The indicator oscillates between positive and negative values. Its magnitude reflects the strength of market forces driving price movements, essentially gauging traders’ commitment and belief in the market’s direction. This unique tool bridges price movement with market psychology, a rare and valuable combination.
In a bullish market, EFI displays a positive reading with a significant absolute magnitude. Conversely, in a bearish market, it shows a negative reading with a high absolute magnitude.
Optimal Timeframe Usage
EFI proves effective across various timeframes. However, cross-checking multiple timeframes enhances signal reliability.
Further Reading: Percentage Price Oscillator AFL Code
Visual Insight
The screenshot below shows Elder’s force index on an Amibroker chart. The index has two versions: EFI(1), which is the product of the current and previous price difference multiplied by volume, and EFI(13), the 13-period exponential moving average of EFI(1).
EFI(1) appears in white, and EFI(13) in blue.
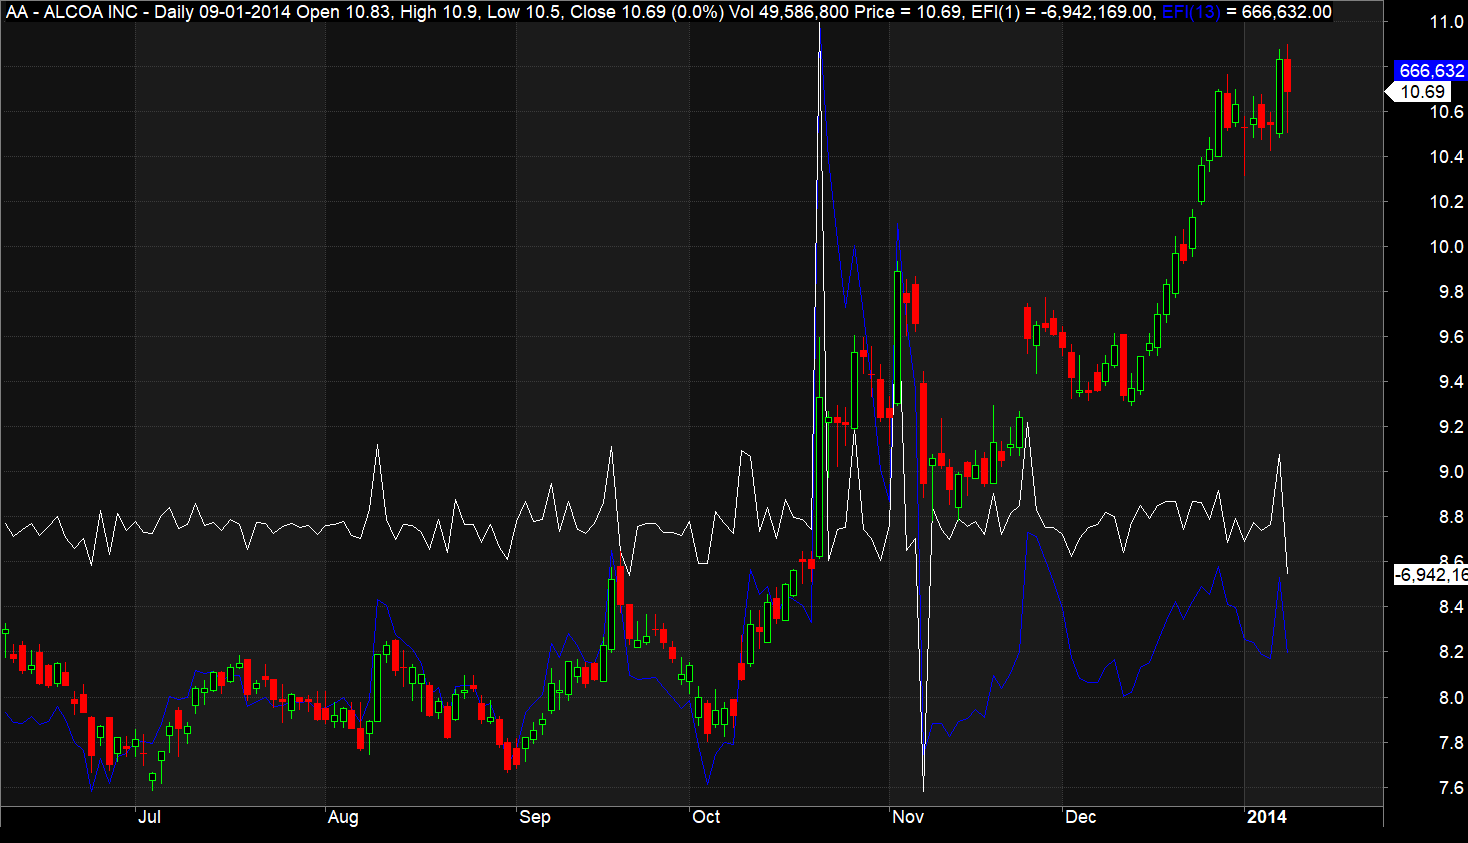 You may also display them as histograms, depending on your preference.
Get the Elder’s Force Index AFL
Access the AFL code for Elder’s force index from the following link:
Elder’s Force Index AFL Download
Decoding the AFL Code
Following the setup of the chart title and candlestick chart, we calculate EFI(1) and EFI(13) using these formulas:
EFI(1) = Difference between Current and Previous Close, multiplied by Current Volume
EFI(13) = 13-period EMA of EFI(1)
Where
EMA = Exponential Moving Average
Afterwards, we plot these lines on a candlestick chart using Amibroker’s classic “plot” function.
Keen to master AFL coding and develop your own profitable trading systems? Explore our AFL learning section.
Trading Strategies with EFI
Consider these rules for long and short trading positions using EFI:
- Maintain a long position when EFI(13) shows a positive reading with significant magnitude.
- Hold a short position when EFI(13) indicates a negative value with substantial magnitude.
- Switch to a long position when EFI(13) transitions from a negative to a positive value.
- Opt for a short position when EFI(13) changes from a positive to a negative value.
- EFI is also useful in spotting technical divergences between price trends and the indicator. For instance, diminishing bullishness is indicated when the price hits a higher high but EFI records a lower high. Similarly, an ending bearish phase is signaled when the price reaches a lower low while EFI shows a higher low.


One Comment