

Options trading carries substantial risk, especially for newcomers. It’s notorious for depleting the trading capital of many retail traders. However, with careful risk management, it can yield remarkable results. In this post, we introduce the proven low-risk Diagonal Spread strategy.
The Perils of Trading Naked Options
Trading naked options is exceptionally risky, particularly without confidence in future price movements. Experienced investors often turn to option spreads, involving both buying and selling option strikes. For example, buying the 8600 Nifty CE and selling the 8800 Nifty CE. This approach hedges positions, limiting risk.
Explore more Options Strategies here.
Understanding the Diagonal Spread Options Strategy
The Diagonal Spread is an options strategy that entails buying a far-month option and selling a near-month option. For instance, buying the 8600 Nifty CE December contract and selling the 8800 Nifty CE November contract constitutes a bullish diagonal spread. This strategy minimizes time decay risk, making it a low-risk options strategy even if the trade goes against you or moves sideways.
Illustrating the Strategy
We’ll apply this strategy to the NSE Nifty Nov Expiry. Assume a bearish view on Nifty at the beginning of November and initiate a bearish diagonal spread by buying one lot of 8800 PE Dec series and selling one lot of 8600 PE Nov series. Below is the trade setup with daily P/L.
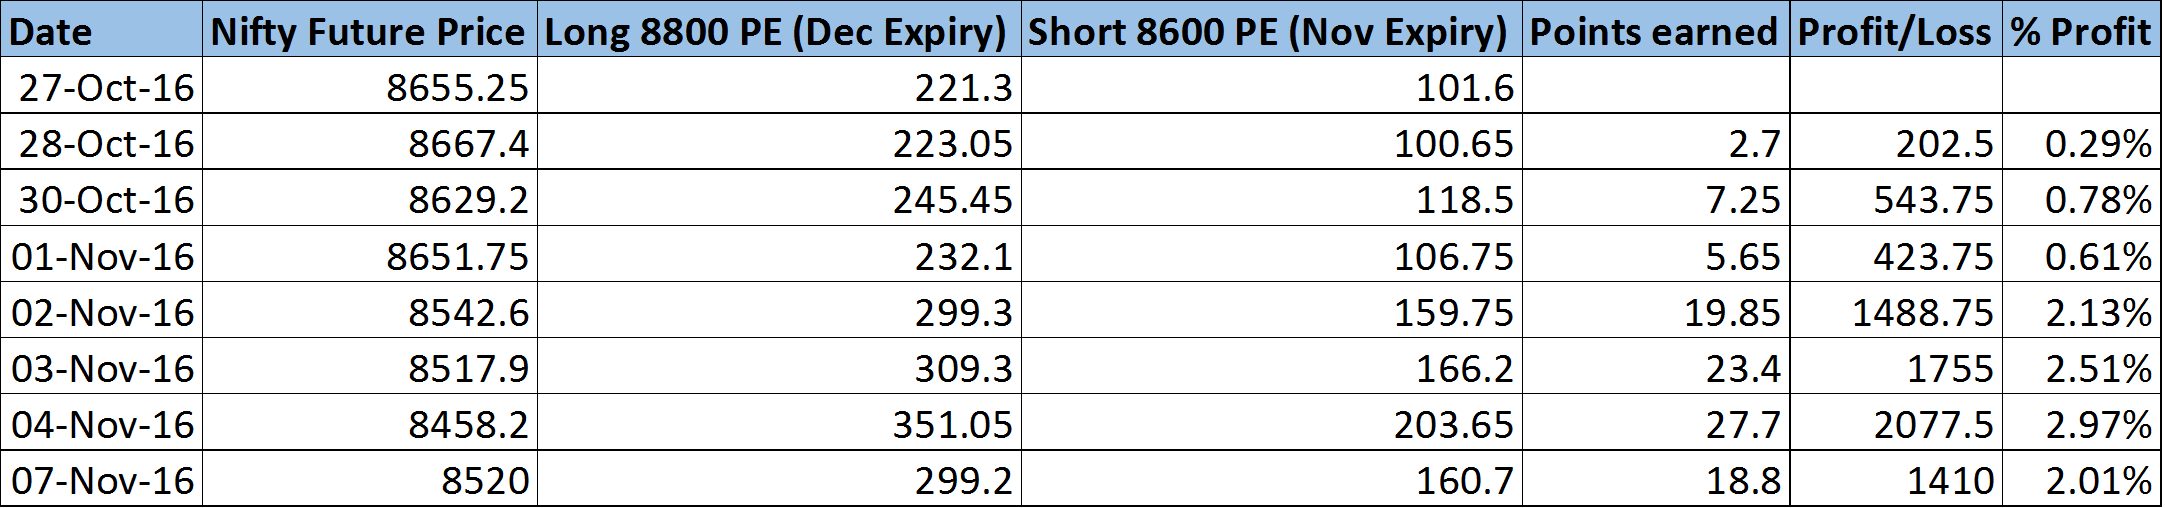
The strategy generated a decent 2% profit in 8 trading days. Profit/Loss is calculated based on 1 lot (75 quantities) of Nifty and an approximate initial margin of 70,000 Rupees. Although naked long Puts may yield better results, they also come with significantly higher risk and susceptibility to sideways movements.
If Nifty expires at 8000 in Nov series, here’s the theoretical value of your position at the end of the series:
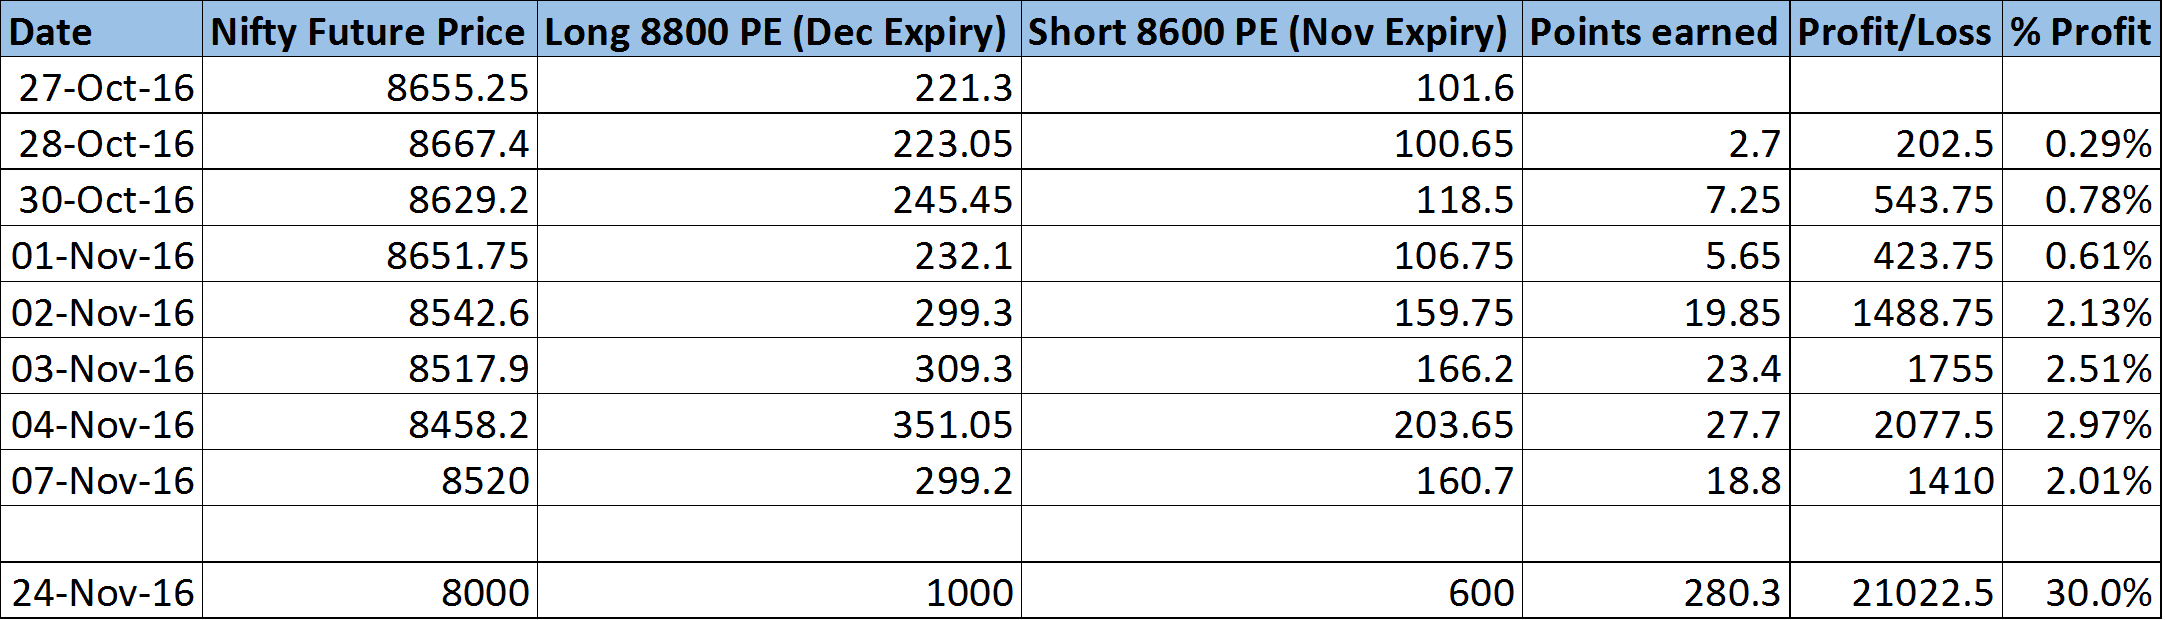
This strategy could have earned 30% in one month if the prediction proves accurate.
Selecting Strike Prices
Choosing strike prices for options trading can be approached in numerous ways. For this strategy, we recommend the percentage hedge method. Follow these steps:
- For the long option, select a strike from the next/far month that is at-the-money (ATM) or slightly out-of-the-money (OTM).
- For the short option, choose a strike from the current/near month that is two strikes OTM from the long strike selected. Optimal results are achieved when long and short options are two strikes apart.
- Calculate the hedge percentage using the formula: Hedge % = (Price of short call / Price of the long call) * 100.
- If the hedge percentage exceeds 30%, proceed with that strike combination. If it’s below 30%, start over by selecting a nearer ATM or ITM option for the long position and recompute the hedge percentage. Most often, ITM long and OTM short options are the ideal combination.
- Once you have a strike combination with a hedge percentage greater than 30%, it’s suitable for entering the trade.
Strategy Summary
| Parameter | Value |
| Trade Setup | Buy ITM or ATM option and Short OTM option. |
| Direction Neutral? | No. Trade Call options if you have a bullish view and Put options if you have a bearish view. |
| Strike Price Selection | Select strike prices to achieve a hedge percentage greater than 30%. |
| When to Enter? | Enter the trade usually 15-30 days before the current month’s expiry. Avoid entering in the expiry week to mitigate time decay. |
| When to Exit? | Exit the trade typically 2-3 days before expiry. |
| Stock Selection | Opt for highly liquid option contracts since this strategy involves buying far-month contracts. |
| Risk Management | Maintain a risk-reward ratio of 2:1 (e.g., 20% target and 10% stop loss). |
Download Excel Sheet: Low-Risk Options Strategy
Download the Excel sheet for the Diagonal Spread: Low-risk options strategy here. Use this sheet to test the strategy’s results on various contracts. Manually enter prices, and the sheet will calculate profit/loss automatically. If you have any questions, feel free to reach out.


One Comment