

Today’s savvy Algorithmic traders often juggle multiple trading systems to achieve consistent success. They use a variety of systems to spread risk and stay prepared for unpredictable market events. For instance, blending non-directional systems with directional ones offers a safety net during volatile or sideways markets.
If you’re considering employing multiple trading systems, it’s crucial to ensure they’re not excessively correlated. Otherwise, the effort is counterproductive. In this post, you’ll learn to create a correlation matrix to gauge the similarity of various systems. We’ll calculate the correlation based on net returns, but other parameters like Drawdowns, Sharpe ratio, and Expectancy can also be used.
A handy spreadsheet template at the end of this post will help you quickly calculate the correlation matrix of trading systems.
Deep Dive into Correlation Matrix
To expand your knowledge about the correlation matrix, its practical uses, and how to calculate it, take a look at the following article:
Correlation Matrix of Stocks in a Spreadsheet – Automatic Data Feed
Spreadsheet Overview: Correlation Matrix of Trading Systems
This spreadsheet is a convenient, one-click tool for generating the correlation matrix of your trading systems.
Here’s a snapshot of the spreadsheet:
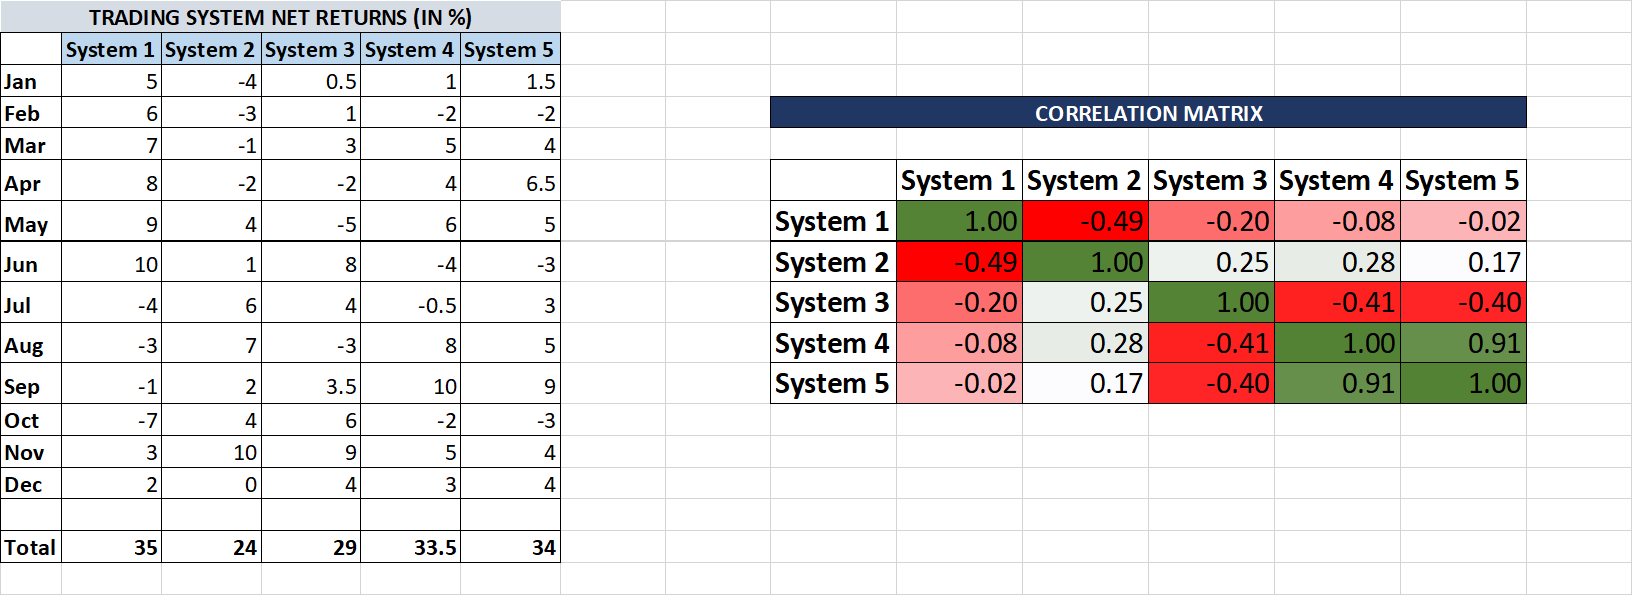
In columns A to F, enter the monthly net returns of your trading systems. The correlation matrix will automatically populate on the right. It’s color-coded, ranging from dark red (for -1) to dark green (for +1).
Each cell in the matrix uses this formula for correlation:
=correl($E:$E,F:F)
It considers two sets of values—one for each system.
Recommended Reading: Calculating Expectancy in Excel
Decoding the Correlation Matrix
Let’s examine a sample correlation matrix:
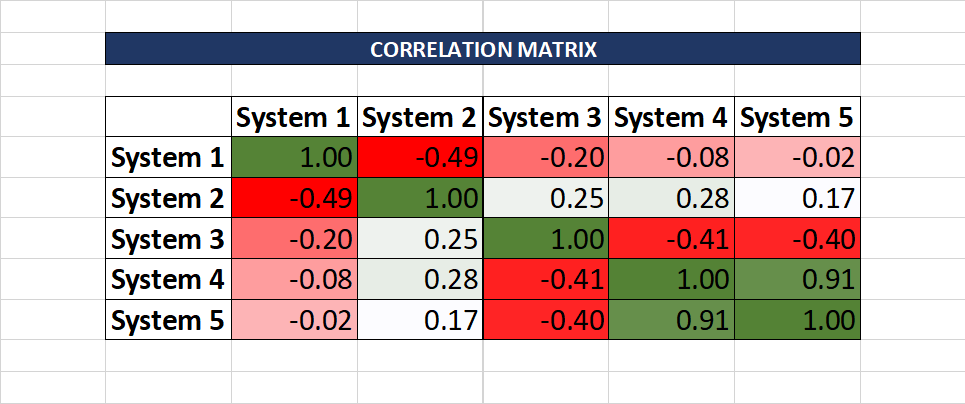
It’s wise to avoid highly correlated systems. For example, Systems 4 and 5 have a correlation of 0.91, indicating a strong similarity. This means gains or losses in one will likely mirror in the other, making it redundant to use both.
Contrastingly, Systems 1 and 2 have a correlation of -0.49, suggesting they are inversely related. This diversifies risk, as gains in one might offset losses in the other.
Keep in mind, if a system’s overall returns are negative, it’s not beneficial to include it in the matrix, as it would be unprofitable regardless of its correlation with other systems.
Download the Spreadsheet
Get the spreadsheet for calculating the Correlation matrix of trading systems here:
Correlation Matrix Trading Systems Excel Sheet
This tool is compatible with MS Excel 2019 and other versions, both older and newer.


One Comment