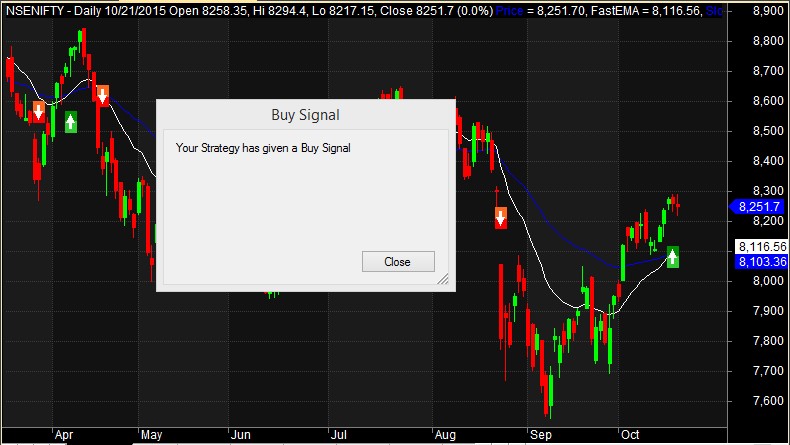
This is Part 4 of Amibroker AFL tutorial series. If you haven’t already gone through Part 1 ,2 and 3 of this series, please refer the below links:-
Amibroker AFL: Step by Step Tutorial- Part 1
Amibroker AFL: Step by Step Tutorial- Part 2
Amibroker AFL: Step by Step Tutorial- Part 3
Plot Text in Chart Area
//------------------------------------------------------ // Formula Name: Plot Text in Chart // Author/Uploader: Trading Tuitions // E-mail: support@tradingtuitions.com // Website: www.tradingtuitions.com //------------------------------------------------------ _SECTION_BEGIN("Plot Text in Chart"); Plot(Close,"Price",color=colorGreen,style=styleCandle); GfxSelectFont("Times New Roman", 30, 700, True ); GfxSetBkMode( colorWhite ); GfxSetTextColor( colorAqua ); GfxTextOut("Close Price:"+C, 900 , 15 ); _SECTION_END();
//------------------------------------------------------ // Formula Name: Popup Alert for Buy/Sell Signals // Author/Uploader: Trading Tuitions // E-mail: support@tradingtuitions.com // Website: www.tradingtuitions.com //------------------------------------------------------ _SECTION_BEGIN("Popup Alert"); SetChartOptions(0,chartShowArrows | chartShowDates); _N(Title = StrFormat("{{NAME}} – {{INTERVAL}} {{DATE}} Open %g, Hi %g, Lo %g, Close %g (%.1f%%) {{VALUES}}", O, H, L, C, SelectedValue( ROC( C, 1 ) ) )); FastEMA=Param("FastEMA",20,1,200,1); SlowEMA=Param("SlowEMA",50,1,200,1); Buy = Cross(ema( C, FastEMA ),ema( C, SlowEMA )); Sell =Cross( ema( C, SlowEMA ), ema( C, FastEMA )) ; Buy = ExRem( Buy, Sell ); Sell = ExRem( Sell, Buy ); Short = Sell; Cover = Buy; if (Buy[BarCount-1]==true) { PopupWindow("Your Strategy has given a Buy Signal","Buy Signal",30); } if (Sell[BarCount-1]==true) { PopupWindow("Your Strategy has given a Sell Signal","Sell Signal",30); } Plot( Close, "Price", colorBlue, styleCandle ); Plot(ema( C, FastEMA ),"FastEMA",colorWhite); Plot(ema( C, SlowEMA ),"SlowEMA",colorBlue); /* Plot Buy and Sell Signal Arrows */ PlotShapes(IIf(Buy, shapeSquare, shapeNone),colorGreen, 0, L, Offset=-40); PlotShapes(IIf(Buy, shapeSquare, shapeNone),colorLime, 0,L, Offset=-50); PlotShapes(IIf(Buy, shapeUpArrow, shapeNone),colorWhite, 0,L, Offset=-45); PlotShapes(IIf(Cover, shapeSquare, shapeNone),colorGreen, 0, L, Offset=-40); PlotShapes(IIf(Cover, shapeSquare, shapeNone),colorLime, 0,L, Offset=-50); PlotShapes(IIf(Cover, shapeUpArrow, shapeNone),colorWhite, 0,L, Offset=-45); PlotShapes(IIf(Sell, shapeSquare, shapeNone),colorRed, 0, H, Offset=40); PlotShapes(IIf(Sell, shapeSquare, shapeNone),colorOrange, 0,H, Offset=50); PlotShapes(IIf(Sell, shapeDownArrow, shapeNone),colorWhite, 0,H, Offset=-45); PlotShapes(IIf(Short, shapeSquare, shapeNone),colorRed, 0, H, Offset=40); PlotShapes(IIf(Short, shapeSquare, shapeNone),colorOrange, 0,H, Offset=50); PlotShapes(IIf(Short, shapeDownArrow, shapeNone),colorWhite, 0,H, Offset=-45); _SECTION_END();
Getting Started with Amibroker – Features, Pros-Cons & Learning Resources
Plotting EMA from multiple Timeframes
//------------------------------------------------------ // Formula Name: Multi Timeframe EMA // Author/Uploader: Trading Tuitions // E-mail: support@tradingtuitions.com // Website: www.tradingtuitions.com //------------------------------------------------------ _SECTION_BEGIN("Multi Timeframe EMA"); SetChartOptions(0,chartShowArrows|chartShowDates); _N(Title = StrFormat("{{NAME}} – {{INTERVAL}} {{DATE}} Open %g, Hi %g, Lo %g, Close %g (%.1f%%) {{VALUES}}", O, H, L, C, SelectedValue( ROC( C, 1 ) ) )); Plot(Close,"Price",color=colorBlue,style=styleCandle); TimeFrameSet(inWeekly); WeeklyEMA20=EMA(C,20); TimeFrameRestore(); TimeFrameSet(inDaily); DailyEMA20=EMA(C,20); TimeFrameRestore(); Plot( TimeFrameExpand( WeeklyEMA20, inWeekly), "20 Period Moving average from Weekly Chart", colorRed ); Plot( TimeFrameExpand( DailyEMA20, inDaily), "20 Period Moving average from Daily Chart", colorBlue); _SECTION_END();