The Underlying Concept of Camarilla Pivot Points
As previously mentioned, the Camarilla method operates on the principle of Mean Reversion. It’s a known fact that most time series tend to revert to the mean. In other words, when there’s a substantial spread between the high and low of the previous day’s trading, the market tends to reverse and return toward the prior day’s closing price. This suggests that intraday support and resistance levels can be forecasted using the previous day’s volatility. This is why pivot levels are derived from the previous day’s price range.
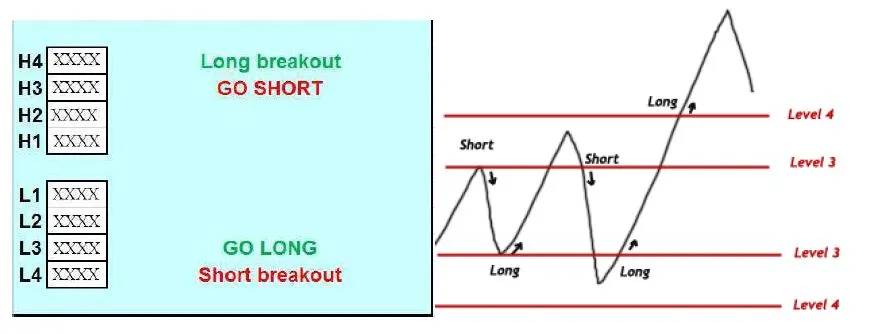
Camarilla Equation Levels
The Camarilla Equation generates eight levels based on the open, high, low, and close from the previous day. These levels are divided into two sets, labeled 1 to 4. The pattern formed by these eight levels is broadly symmetrical, with the most crucial levels being ‘L3,’ ‘L4,’ ‘H3,’ and ‘H4.’ When day trading, traders watch for potential market reversals when prices touch an ‘L3’ or ‘H3’ level. They may then open positions in the opposite direction, using stop-loss orders placed just before the associated ‘L4’ or ‘H4’ level. You can use the calculator at the top of this post to calculate Camarilla Equation levels.
Another approach to day trading using the Camarilla Equation is to consider the ‘H4’ and ‘L4’ levels as ‘breakout’ levels. In other words, traders go in the direction of the trend if prices break through either the H4 or L4 level. This strategy covers a wide range of scenarios, allowing day traders to navigate intraday market fluctuations effectively. The H4 – L4 breakout plays are particularly suitable for less experienced traders, as they enable capitalization on relatively low-risk, sharp, and powerful market movements.
Trading Strategies with Camarilla Pivot Points
To implement trading strategies based on Camarilla Pivot Points:
1. Begin by examining the opening price of the selected stock, futures, commodities, or currency.
2. If the opening price falls between H3 and L3:
For Long Positions:
Wait for the price to drop below L3 and then buy when it rises above L3. Set the stop-loss just below L4. Targets: H1, H2, H3.
For Short Positions:
Wait for the price to rise above H3 and then sell when it falls below H3. Set the stop-loss just above H4. Targets: L1, L2, L3.
3. If the opening price falls between H3 and H4:
For Long Positions:
Buy when the price moves above H4. Set the stop-loss at H3. Targets: 0.5% to 1%.
For Short Positions:
Sell when the price falls below H3. Set the stop-loss at H4. Targets: L1, L2, L3.
4. If the opening price falls between L3 and L4:
For Long Positions:
Buy when the price moves above L3. Set the stop-loss at L4. Targets: H1, H2, H3.
For Short Positions:
Sell when the price falls below L4. Set the stop-loss at L3. Targets: 0.5% to 1%.
5. If the opening price is above H4, it’s not recommended to go long. For short positions, wait for the price to fall below H3 and set the stop-loss just above H4. Targets: L1, L2, L3.
6. If the opening price is below L4, it’s not recommended to go long. Short positions can be initiated when the price rises above L3, with the stop-loss just below L3. Targets: H1, H2, H3.
Trading Example with Camarilla Pivot Points
Let’s calculate Camarilla Pivot Points for NSE Nifty on May 16, 2016. We’ll need the High, Low, and Close levels from May 13, 2016, for this calculation. Refer to the screenshot below for the calculation:
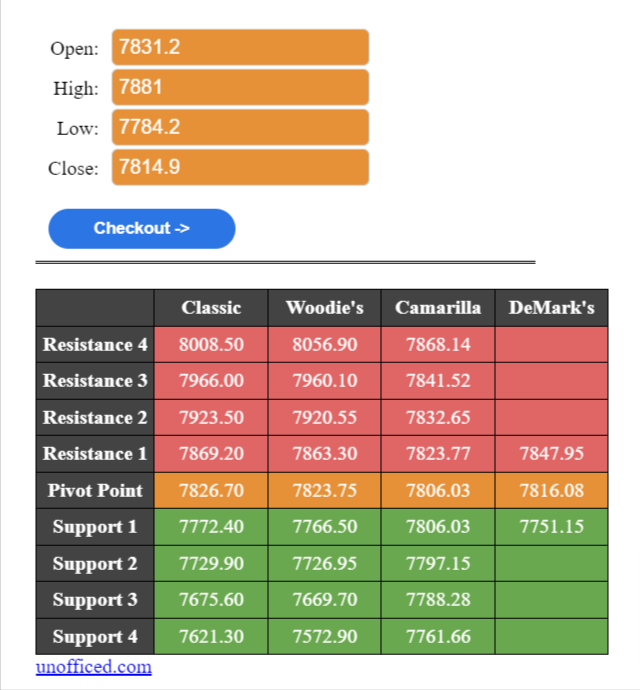
On May 16, Nifty opened at 7831.20, which falls between H3 and L3. This aligns with scenario 1. Subsequently, at approximately 10:58 AM, the Nifty’s price dropped below L3 (7788.28). In this situation, we should wait for the price to rise back above L3 before taking a Buy position. At around 11:04 AM, it gave a Buy Signal, with the stop-loss set at L4 (7761.66) and targets at H1, H2, and H3. As shown in the chart below, all the targets were met later in the day, while the stop-loss was never triggered. Partial profit booking at each target level is an option.

Try applying this method to different stocks and commodities, and you’ll likely be impressed by its accuracy. Feel free to ask any questions in the comments section.