Trading Performance Summary
| Parameter | Value |
|---|---|
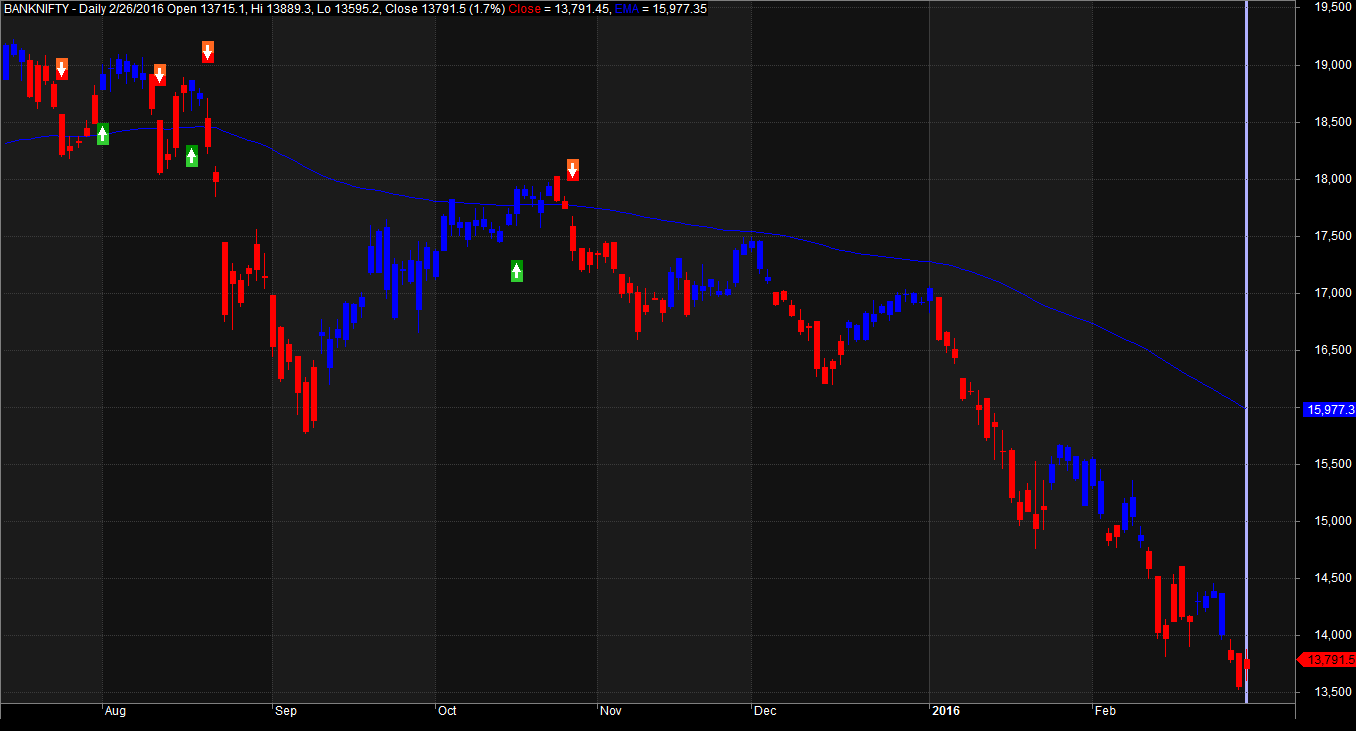
| Asset | NSE BankNifty |
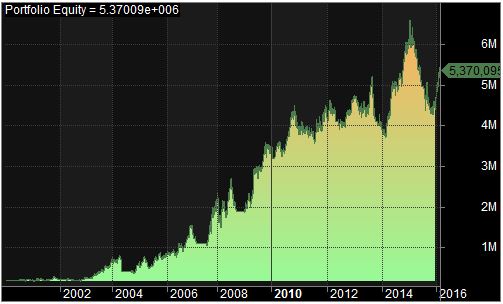
| Initial Capital | $200,000 |
| Final Capital | $5,370,094.50 |
| Backtest Period | June 9, 2000 to February 26, 2016 |
| Timeframe | Daily |
| Net Profit Percentage | 2585.05% |
| Annual Return Percentage | 22.58% |
| Number of Trades | 110 |
| Winning Trade Percentage | 28.18% |
| Average Holding Period | 30.73 periods |
| Max Consecutive Losses | 12 |
| Max System Percentage Drawdown | -56.04% |
| Max Trade Percentage Drawdown | -62.51% |
You can download the detailed backtest report here.
Please note that if you allow for the compounding of your returns, you may achieve even better results.
Also Read: Excel-Based Moving Average Trading System
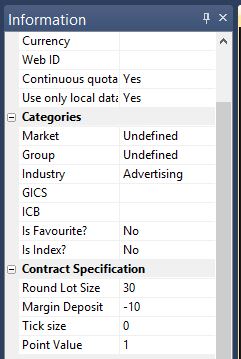
Additional Amibroker Settings for Backtesting
To specify lot size and margin requirements, navigate to Symbol → Information in Amibroker. Below is a screenshot illustrating a lot size of 30 and a margin requirement of 10% for Bank Nifty: