Understanding VWAP: A Valuable Tool for Traders
Volume Weighted Average Price (VWAP) stands as an essential tool for forecasting stock price movements, benefiting intraday traders. While it doesn’t directly generate trading signals, it plays a pivotal role in facilitating strategic entries to buy low and sell high. When harmonized with other trading indicators, it can significantly bolster the precision of your trading strategy. Institutional investors and hedge funds also find value in VWAP, leveraging it to execute trades without causing abrupt price fluctuations. VWAP’s incorporation of stock volume data offers insights into current market momentum and the genuine average price. In this article, we will delve into a VWAP Trading Strategy Excel sheet, which is designed to compute absolute VWAP values for various intraday timeframes.
If you’re interested in other Excel-based trading systems, check out our Excel-Based Trading Systems section.
Calculating VWAP: Unveiling the Method
VWAP’s name discloses its essence: it represents the weighted average of a stock’s price over a defined time period. The stock price’s weighting hinges on the volume traded during that specific time frame. The formula to compute VWAP is structured as follows:
∑ (Number of Shares Purchased x Price of the Shares) ÷ Total Shares Bought During the Period
This formula essentially entails multiplying the number of shares by their respective prices and then dividing the result by the total number of shares. Because VWAP considers trading volume, it offers a more reliable gauge compared to a simple moving average.
The process of computing VWAP involves several steps:
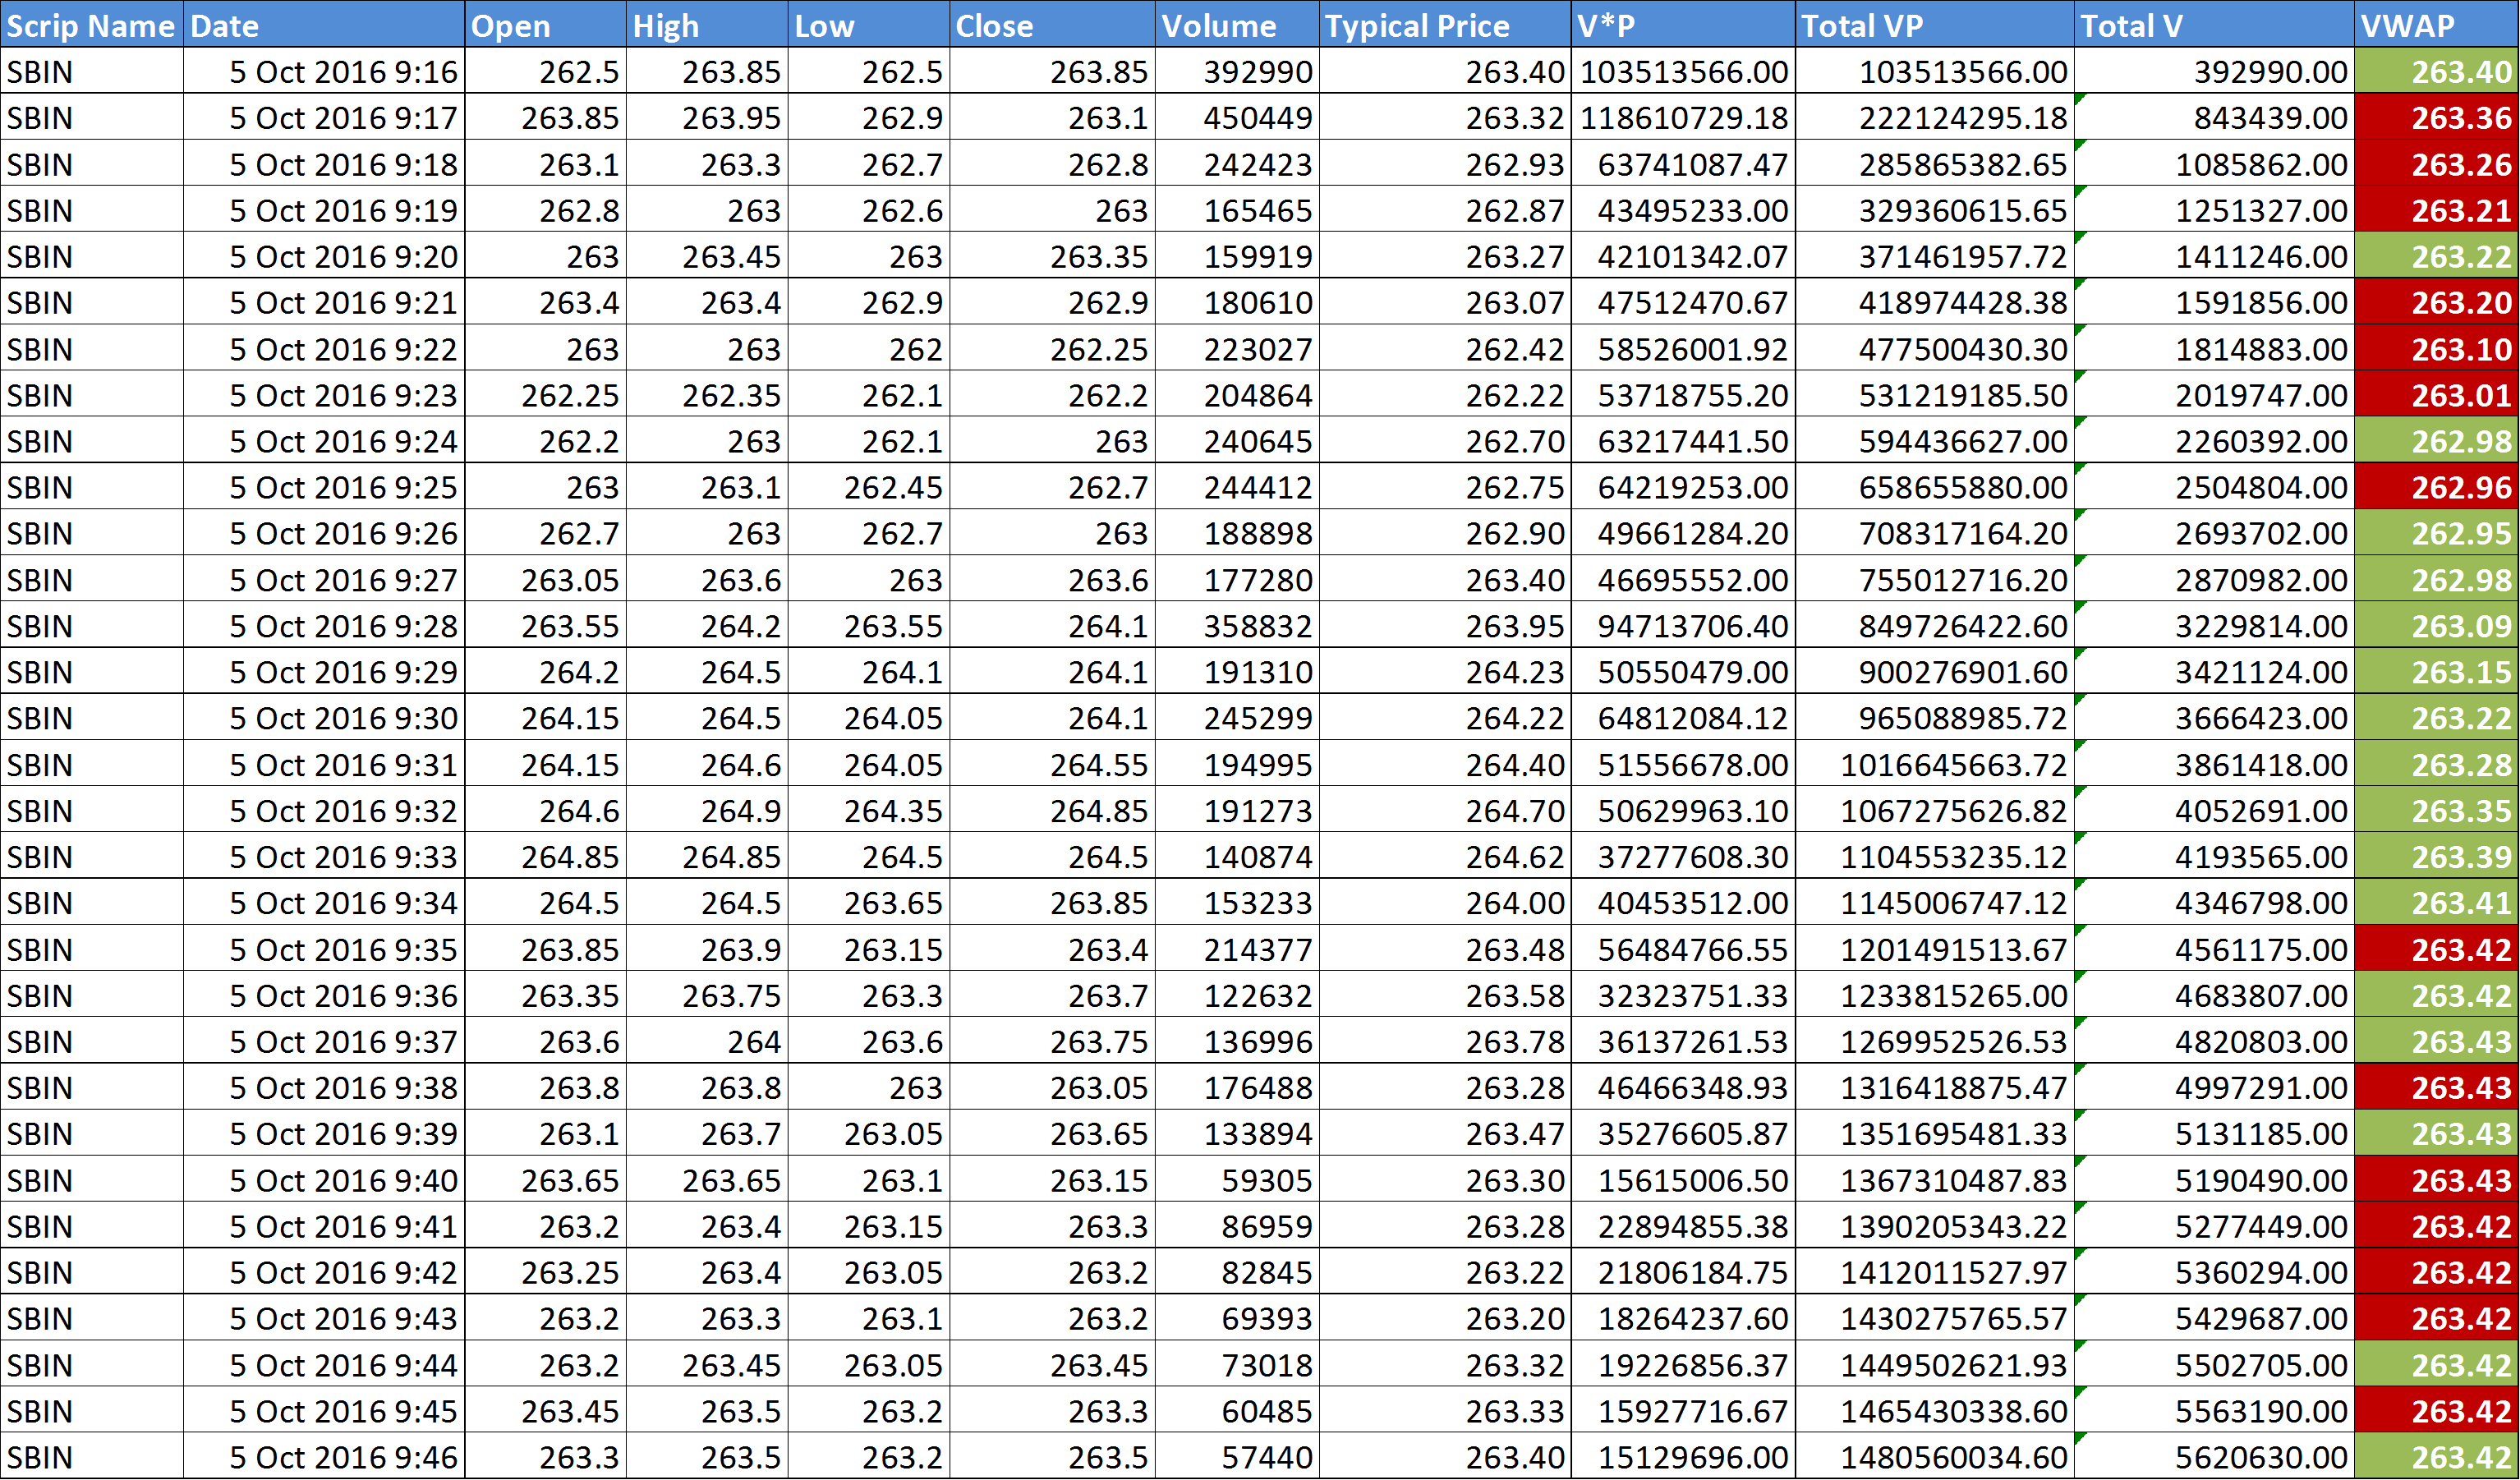
- Calculate the average or typical price movement of the stock during the specified time period using the formula: (High + Low + Close) ÷ 3.
- Multiply the volume of the period by the typical price computed in step 1.
- Compute the cumulative total of the values obtained in step 2.
- Calculate the cumulative total of the trading volume.
- Determine the ratio between the values calculated in step 3 and step 4. This ratio is referred to as VWAP.
VWAP’s Versatile Applications
VWAP’s versatility equips it with a multitude of applications in the trading realm, delivering benefits to both institutional investors and retail intraday traders. Noteworthy applications of VWAP include:
-
- Identifying opportune moments to buy low and sell high. A price below VWAP is perceived as undervalued, whereas a price above VWAP is regarded as overvalued.
- Observing price crossovers above or below the VWAP line on a chart, indicating shifts in momentum or changes in the prevailing trend.
- Adopting VWAP as a trading benchmark, particularly by institutional investors who prioritize the impact of their trades on a security’s price over timing.
- Deploying VWAP as a reference point for intraday price analysis, enabling chartists to compare current prices against VWAP values, providing insights into the intraday trend.
- Harnessing the VWAP indicator as a dynamic support and resistance line during sideways market conditions.
Exploring the VWAP Trading Strategy Excel Sheet 
Here are the steps for using the VWAP Trading Strategy Excel Sheet:
Step 1: Download the Excel file from the end of this article.
Step 2: Open the Excel file and ensure that you have an active internet connection. If prompted, enable Macros and Data connections.
Step 3: Input the Symbol Name, Exchange Name, Interval, and Number of Days.
Step 4: Click the “Get Data” button. The data will be automatically downloaded, and the chart will be refreshed. The final column indicates the VWAP value.
Step 5: A green cell signifies that VWAP is below the closing price, indicating undervaluation, while a red cell indicates VWAP is above the closing price, indicating overvaluation.
Download the VWAP Trading Strategy Excel Sheet
To access the VWAP Trading Strategy Excel Sheet, please follow this link. If you have any questions or suggestions for improvement, feel free to reach out to us.


One Comment