
Discover the Parabolic SAR Trading System, a powerful tool crafted by J. Welles Wilder. He introduced this system in 1978, in his book “New Concepts in Technical Trading Systems.” The system’s stops, when plotted, resemble a parabola, hence the name. It operates on the ‘Stop and Reverse’ principle, ensuring you always have a position in the market, be it Long or Short. If a stop loss is triggered, your position reverses. That’s why we call each stop point ‘SAR’ – Stop And Reverse. In this post, we’ll explore a fully automated Parabolic SAR Excel sheet.
The system gives the market a few initial candles to react before its stop accelerates. The stop’s movement depends on both price and time. In an uptrend, the stop moves UP daily, regardless of price direction. It’s tied to price by considering the distance the price has moved favorably.
Also Read: Trading Precision: Parabolic SAR System with AFL Code!
How to Use Parabolic SAR for Trading?
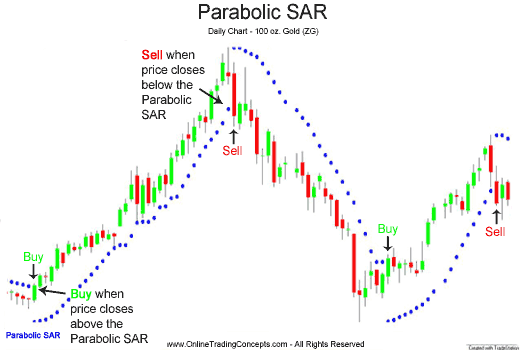
Parabolic SAR is incredibly user-friendly. When overlaid on a stock chart, it places dots above or below the price line.
- If you see PSAR dots below the price, it’s a buy signal.
- If you spot PSAR dots above the price, it’s a sell signal.
Parabolic SAR works well in trending markets but can give mixed signals in sideways phases. Many traders also use Parabolic SAR as a stop-loss indicator.
Calculations for the Parabolic SAR Excel Sheet
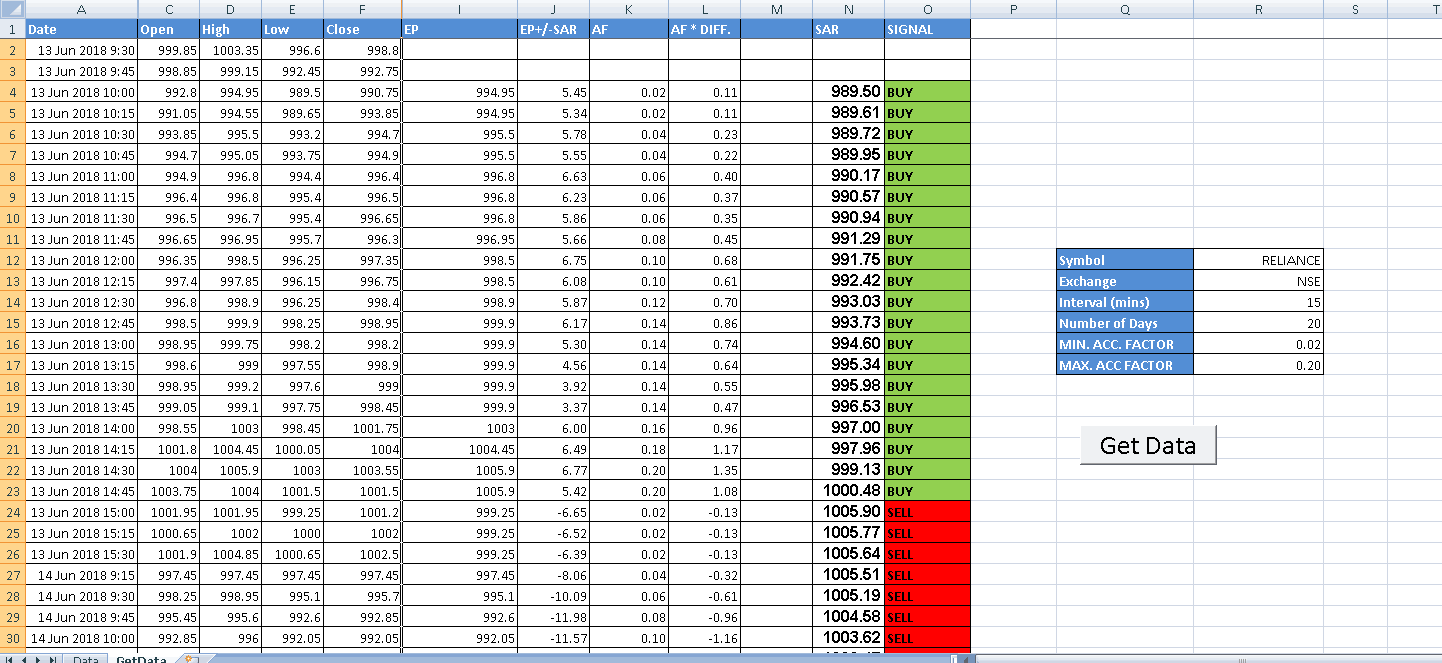
Here are some key terms for Parabolic SAR calculations:
Previous SAR = SAR value from the previous period.
Extreme Point (EP) = The highest price achieved in the current trend’s direction.
Acceleration Factor (AF) = Determines the rate of change for the SAR.
The calculations for Parabolic SAR differ for uptrends and downtrends.
Parabolic SAR in Uptrend = Previous SAR + Previous AF(Previous EP – Previous SAR)
Parabolic SAR in Downtrend = Previous SAR – Previous AF(Previous SAR – Previous EP)
Parabolic SAR forms a parabola on the chart. When the price breaks below the parabola in an uptrend, it signals a potential reversal. In a downtrend, a price break above the parabola can also indicate a reversal.
One aspect to consider is the Acceleration Factor (AF) mentioned in the calculation. AF, which increments in user-defined levels, determines the sensitivity of the SAR. A lower AF keeps SAR farther from the price, making it less likely to trigger a stop or reversal. A higher value for AF makes SAR more price-sensitive and more likely to trigger. Welles Wilder’s suggested default values for AF increments and maximum AF are 0.02 and 0.20, respectively.
Parabolic SAR is typically displayed on the chart as a series of dots, guiding your stop-loss placement. A small dot appears below the price in an uptrend, while a dot is positioned above the price in a downtrend.
Also Read: Technical Analysis vs Fundamental Analysis
Parabolic SAR Excel Sheet Overview
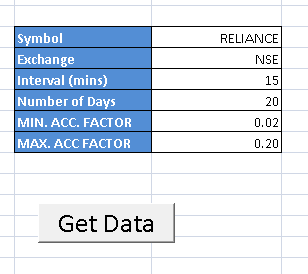
Explore this automated, macro-enabled spreadsheet that calculates Parabolic SAR values and Buy/Sell signals for your selected symbol. It offers the convenience of automation.
Take a look at the screenshots below:
How to Use This Excel Sheet
Step 1: Download the Excel file using the link provided at the end of this post.
Step 2: Open the Excel file and ensure your internet connection is active. Please enable Macros and Data connections if prompted.
Step 3: Enter the Symbol Name, Exchange Name, Interval, Number of Days, Minimum AF, and Maximum AF.
Step 4: Click the ‘Get Data’ button. The data will be downloaded automatically, and Parabolic SAR values will be calculated.
Download Link for the Parabolic SAR Excel Sheet
Download the Parabolic SAR Excel sheet via the following link. We welcome your feedback and comments.