

Intraday Trading with the Gann Square of 9 Calculator
The Gann Square of 9 calculator is a valuable tool for generating support and resistance levels in intraday trading. Breakouts from these levels are used as trade entry points. The support and resistance levels are computed using values within the Gann Square. To calculate these levels, you must input the latest trade price or weighted average price into the Gann calculator (provided in this post). It’s advisable to use the last traded price (LTP) after at least half an hour of trading for more reliable results, as market volatility is high during the initial 30 minutes. Once you input the price, the Gann levels will be automatically generated.
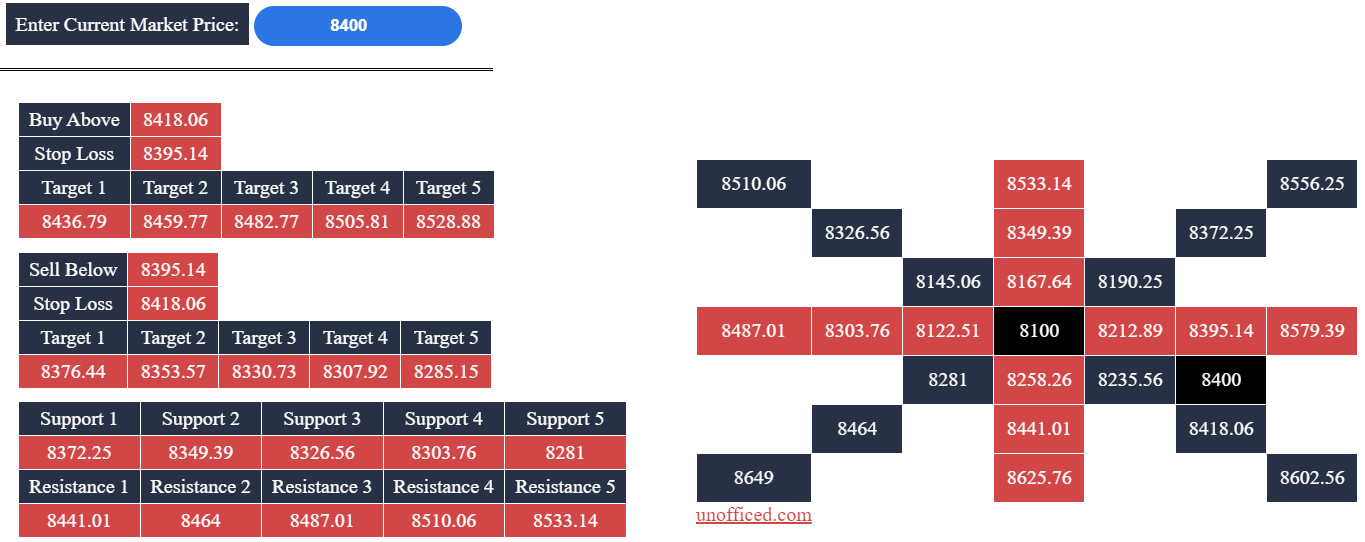
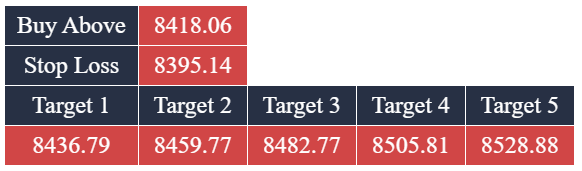
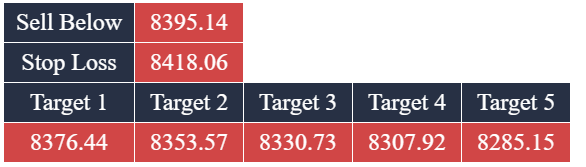
Furthermore, the calculator will provide buy/sell prices and corresponding targets. In this example, you should buy if the price surpasses 8418.06 and sell if it falls below 8395.14.
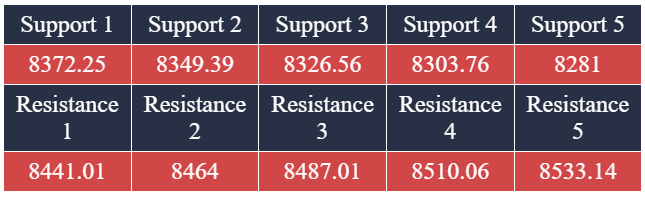
Finally, there are support and resistance levels used to calculate targets.
How to Calculate Gann Values
Every value in the Gann Square is related to the central value. Here are the steps for calculating these values:
- Calculate the square root of the last traded price (LTP). For instance, if LTP is 8400, then SQRT(8400)=91.65.
- Select two integers just below and above the square root. In this case, they would be 90, 91, 92, and 93.
- Square the lowest value among the four calculated above. SQR(90)=8100. Place this value at the center of the Gann Square.
- Increment 90 by 45 degrees. In numerical terms, 45 degrees is equal to 0.125 (360 degrees=1). So, our next value is 90.125.
- Calculate the square of 90.125 and position it in the block to the left of the center block. SQR(90.125)=8122.52.
- Continue increasing the value by 45 degrees. 90.125 + 0.125 = 90.25. Calculate the square of this value and place it at the top of where you positioned 8122.52. SQR(90.25)=8145.06.
- Repeat this process by increasing the value by 0.125 for each iteration.
- Once you complete one level of the square, start the next level with values like 91.125, 91.25, and so on.
Resistance values are the higher values in the Gann Square above the Buy Price, while support values are the lower values below the Sell price. Targets are calculated based on these support and resistance levels.


One Comment