
Acceleration Bands are a momentum indicator that takes into account a stock’s volatility over a set period, typically 20 days or weeks. This indicator is displayed as a set of three bands on a chart: an upper band, a lower band, and a central band.

These upper and lower bands define a trading range. A breakout above or below these bands signals a swift ‘acceleration’ in the stock’s price. For example, a breakout from the upper band suggests a rapid increase in price in the coming days or weeks.

The middle band represents a simple moving average.

This tool was developed by Price Headley, the founder of bigtrends.com.

Read Also: Unlocking the Power of Algorithmic Trading

Optimal Timeframe

Acceleration Bands are most effective in longer timeframes, such as daily or weekly charts.

Indicator Display

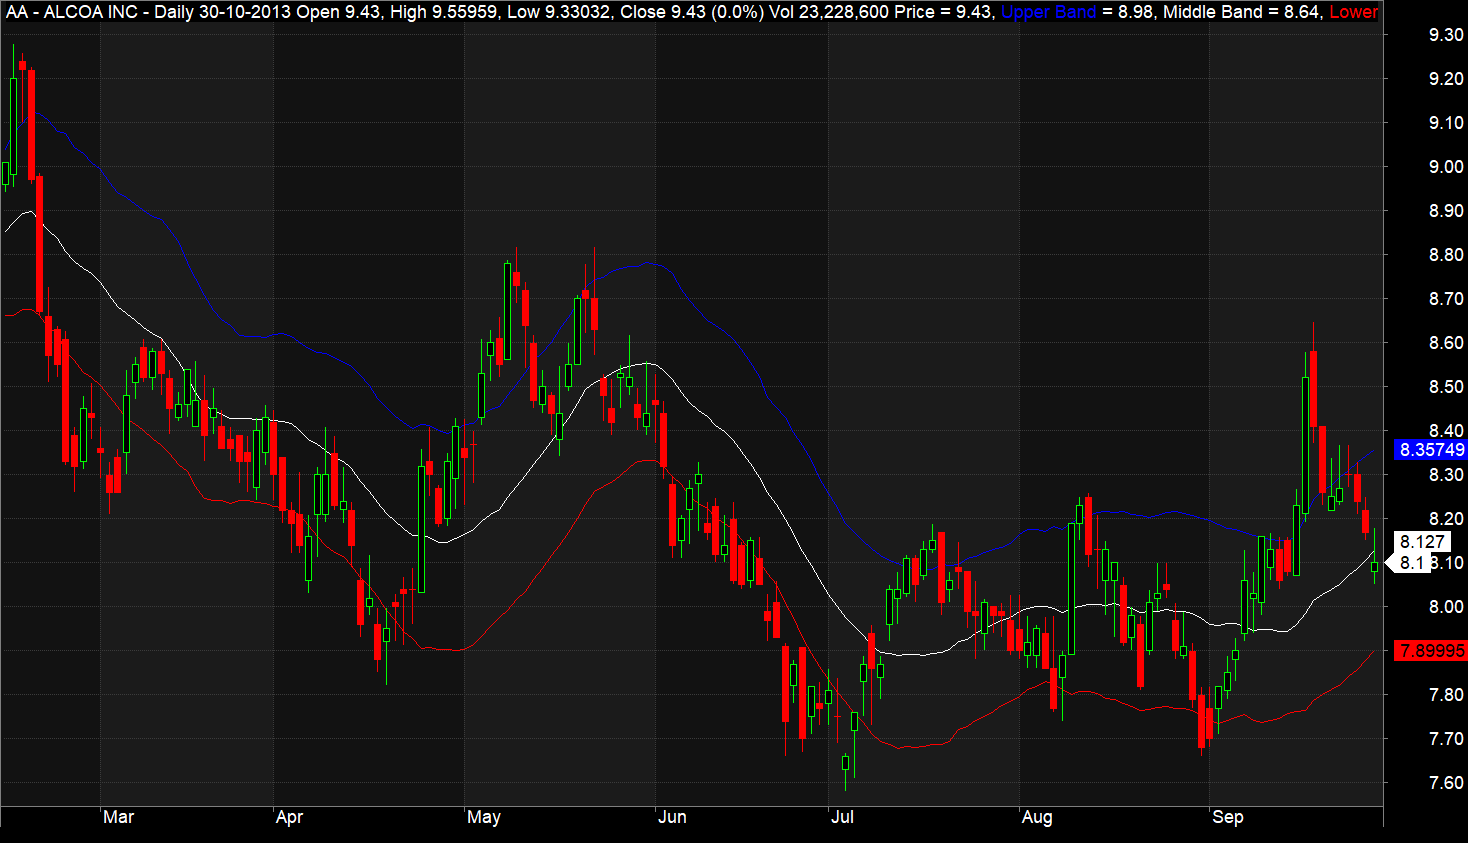
The following screenshot shows Acceleration Bands on an Amibroker chart. The upper band is marked in blue, the lower band in red, and the middle band in white.

Acceleration-Bands-AFL-Screenshot

Downloading Acceleration Bands AFL

				
					//------------------------------------------------------
//
//  Formula Name:    Acceleration Bands
//  Website:         https://zerobrokerageclub.com/
//------------------------------------------------------

_SECTION_BEGIN("Acceleration Bands");

SetChartOptions(0,chartShowArrows|chartShowDates);

_N(Title = StrFormat("{{NAME}} – {{INTERVAL}} {{DATE}} Open %g, Hi %g, Lo %g, Close %g (%.1f%%) {{VALUES}}", O, H, L, C, SelectedValue( ROC( C, 1 ) ) ));


Plot( Close, "Price", colorWhite, styleCandle );

LookbackPeriods = Param("LookbackPeriods",20,5,100,5);
range=(H-L)/(H+L)/2;

Upperband=MA(H*(1+2*((2*range)*100)*.01),LookbackPeriods);
Lowerband= MA(L*(1-2*((2*range)*100)*.01),LookbackPeriods);
Middleband=MA(C,LookbackPeriods);
 
 
Plot(Upperband, "Upper Band",colorBlue,styleLine);
Plot(Middleband, "Middle Band",colorWhite,styleLine);
Plot(Lowerband, "Lower Band",colorRed,styleLine);

_SECTION_END();


Understanding the AFL Code

The AFL code for Acceleration Bands is straightforward. It calculates the upper, lower, and middle bands using these formulas:

  • Upperband=MA(H*(1+2*((2*range)*100)*.01),LookbackPeriods);
  • Lowerband= MA(L*(1-2*((2*range)*100)*.01),LookbackPeriods);
  • Middleband=MA(C,LookbackPeriods);

where:

  • MA = Simple moving average
  • Range = (High – Low) / (High + Low)/2
  • LookbackPeriods = Moving average time period, usually 20 days or weeks

These bands are then plotted on a candlestick chart using Amibroker’s standard “plot” function. You could also use an Exponential Moving Average (EMA) instead of a Simple Moving Average (MA) for more precise and timely breakout signals.

Interested in learning AFL coding from the ground up and creating your own profitable trading systems? Visit our AFL section.

Trading Rules for Long and Short Positions

To use Acceleration Bands for trading:

  • Consider going long when the price crosses above the upper band and exit when it falls back below it.
  • Consider going short when the price drops below the lower band and exit when it rises above it.
  • Based on your risk tolerance, you could also use middle band crossovers to close open positions.