
Unlocking Amibroker: A Trader’s Essential Tool
Amibroker stands out as a crucial tool for traders globally, known for its versatility in supporting both discretionary and system traders. It’s packed with powerful features like an advanced backtesting and optimization engine, along with standard charting functionalities. Amibroker even lets you craft custom indicators and fully automated trading systems. To start building in Amibroker, familiarize yourself with its programming language, Amibroker AFL. It’s user-friendly, even for those without a programming background, saving you from spending on costly ready-made AFLs.
Further Reading: Mastering Amibroker – A Comprehensive Guide
Starting with Amibroker AFL
In this tutorial, we’ll explore Amibroker AFL from scratch, complete with examples and downloadable code. This assumes you’ve already set up Amibroker and have access to live or historical data. A basic grasp of technical analysis and trading terms is beneficial for coding in Amibroker.
The code snippets here and in future posts are easy to copy and paste. We’ll start simple and gradually introduce more complexity. If you get stuck, just leave a comment.
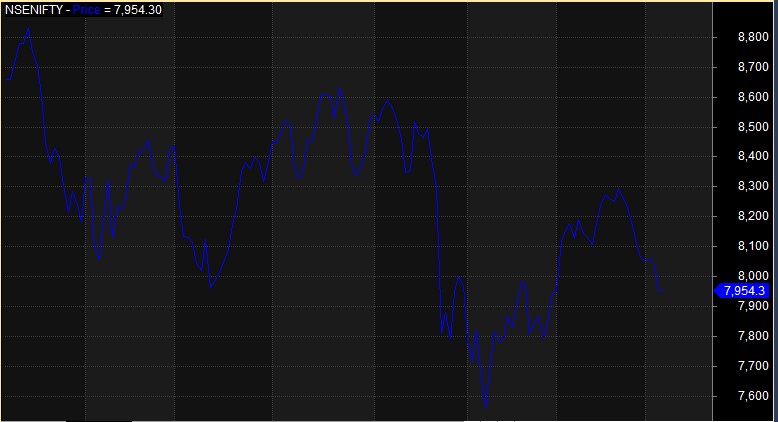
Creating Your First Amibroker AFL: Line Chart
					//------------------------------------------------------
//  Formula Name:    Basic Line Chart
//  Website: https://zerobrokerageclub.com/
//------------------------------------------------------

_SECTION_BEGIN("Basic Line Chart");
Plot(Close,"Price",color=colorBlue,style=styleLine);
_SECTION_END();
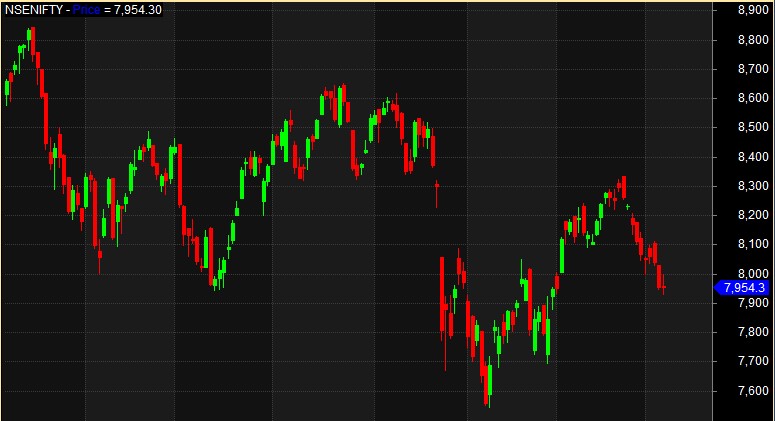
Creating a Candlestick Chart
					//------------------------------------------------------
//  Formula Name:    Basic Candlestick Chart
//  Website: https://zerobrokerageclub.com/
//------------------------------------------------------

_SECTION_BEGIN("Basic Candlestick Chart");
Plot(Close,"Price",style=styleCandle);
_SECTION_END();
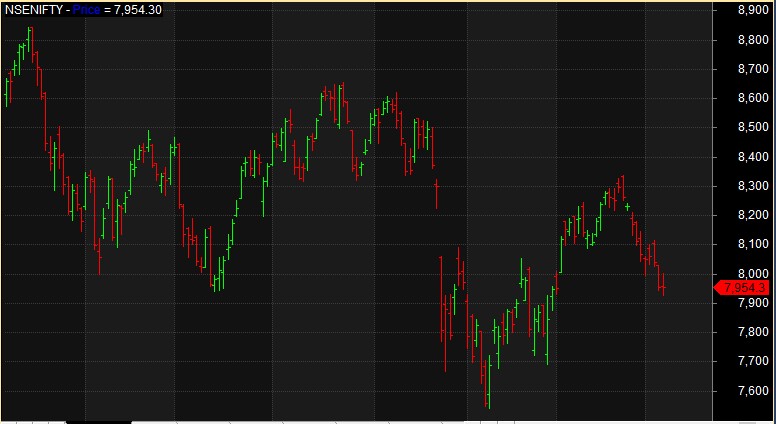
Designing a Bar Chart
					//------------------------------------------------------
//  Formula Name:    Basic Bar Chart
//  Website: https://zerobrokerageclub.com/
//------------------------------------------------------

_SECTION_BEGIN("Basic Bar Chart");
Plot(Close,"Price",color=colorBlue,style=styleBar);
_SECTION_END();
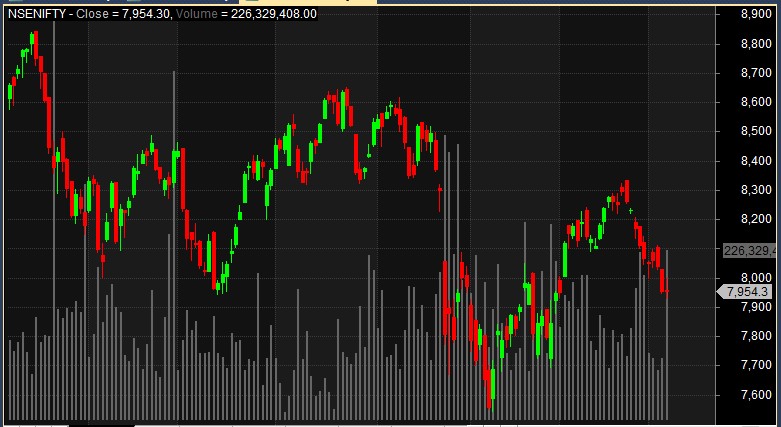
Integrating Price and Volume in Your Chart
					//------------------------------------------------------
//
//  Formula Name:    Price with Volume
//  Website: https://zerobrokerageclub.com/
//------------------------------------------------------

_SECTION_BEGIN("Price");
Plot( C, "Close", colorDefault,styleCandle );
_SECTION_END();

_SECTION_BEGIN("Volume");
Plot( Volume, "Volume", color=colorGrey40, ParamStyle( "Style", styleHistogram | styleOwnScale | styleThick, maskHistogram  ) );
_SECTION_END();
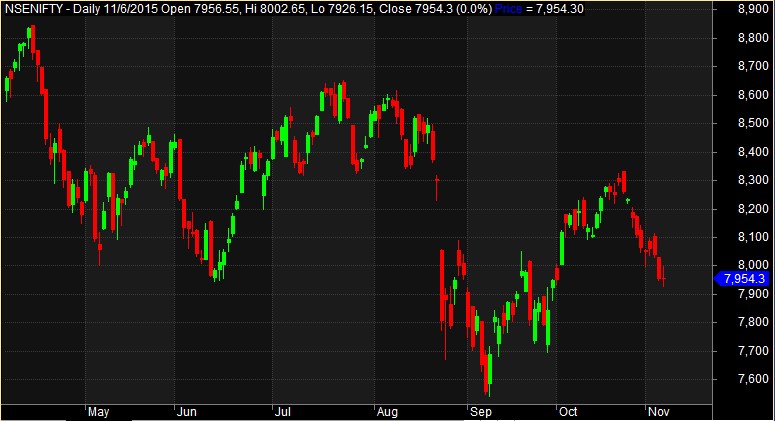
Customizing Your Chart’s Title
					//------------------------------------------------------
//
//  Formula Name:    Displaying Chart Title
//  Website: https://zerobrokerageclub.com/
//------------------------------------------------------

_SECTION_BEGIN("Chart with Title");
SetChartOptions(0,chartShowArrows|chartShowDates);
_N(Title = StrFormat("{{NAME}} – {{INTERVAL}} {{DATE}} Open %g, Hi %g, Lo %g, Close %g (%.1f%%) {{VALUES}}", O, H, L, C, SelectedValue( ROC( C, 1 ) ) ));

Plot(Close,"Price",color=colorBlue,style=styleCandle);
_SECTION_END();
 Now that you’re familiar with basic AFL syntax, try experimenting in Amibroker by tweaking some parameters in AFL functions and observe the changes in your charts. Stay tuned for Part-2 of this tutorial series.

3 Comments