Day trading can often feel perplexing and uncertain without a solid grasp of the basics. For success in intraday trading, it’s crucial to have reliable indicators and patterns at your disposal. Stochastic is a tried-and-tested indicator that has been around for quite a while. It’s versatile, suitable for both intraday and swing trading. In this post, we delve into a Intraday Stochastic trading system that has yielded an impressive 63%~ annual compounded returns over the past three years. Plus, we’ve provided the Amibroker AFL code for this system.
Unpacking the Stochastic Indicator and Its Calculation
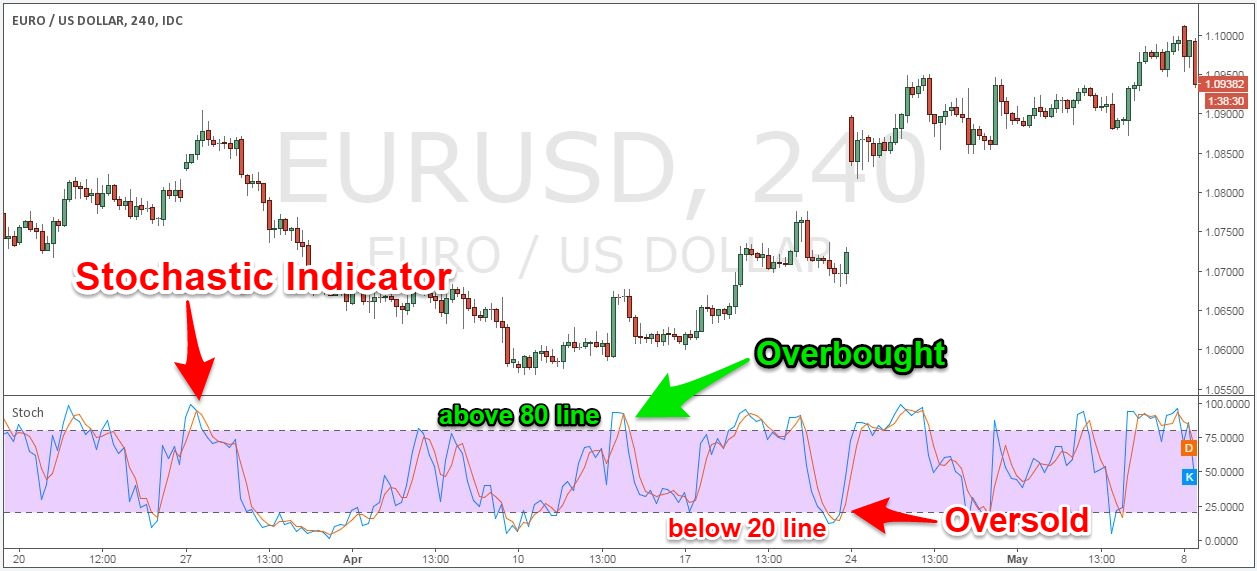
Stochastic is a momentum indicator that reflects the strength of the current trend by comparing the current price to a range of prices over a specified lookback period. As an oscillator, its value swings between 0 to 100, making it a reliable tool to spot overbought and oversold price levels.
 Reference: https://tradingstrategyguides.com/best-stochastic-trading-strategy/
The Stochastic Indicator was crafted by George C Lane in the 1950s. In an interview, Lane mentioned that the Stochastic Oscillator “doesn’t follow price or volume, but the speed or the momentum of price. Typically, the momentum shifts direction before the price.”
Here’s how the Stochastic Indicator is calculated:
%K = (Current Close – Lowest Low)/(Highest High – Lowest Low) * 100
%D = 3-day SMA of %K
Where Lowest Low = lowest low over the look-back period
And Highest High = highest high over the look-back period
The default look-back period is 14 days, adjustable based on the security traded. Trading signals emerge when the %K line of Stochastic crosses the %D line.
Moreover, Stochastic Divergences are great at pinpointing price reversals. Divergence happens when the price trend and the indicator trend move in opposite directions.
Continue reading to discover a profitable trading system based on Stochastic:
Click Here to delve into AFL coding and craft your own Trading systems.
Intraday Stochastic Trading System – A Glimpse into the AFL
| Parameter | Value |
|---|---|
| Preferred Time-frame | 5 Minutes |
| Indicators Used | StochD, StochK |
| Buy Condition |
|
| Short Condition |
|
| Sell Condition |
|
| Cover Condition |
|
| Stop Loss | 0.5% |
| Targets | 1% |
| Position Size | 100% of equity |
| Initial Equity | 200000 |
| Brokerage | 100 per order |
| Margin | 10% |
Get the Intraday Stochastic Trading System – AFL Code
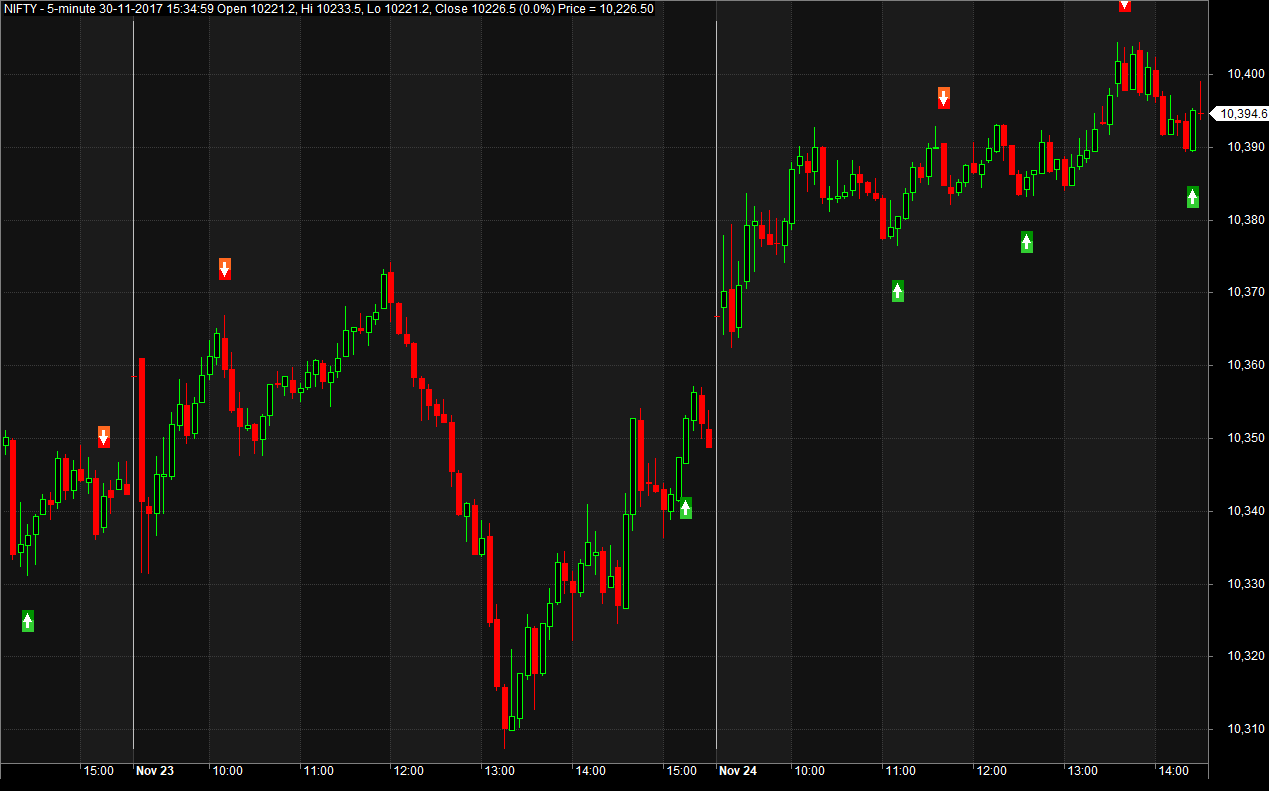
AFL Screenshot
 Also Read: The Ichimoku Trading Strategy: Amibroker AFL Code
Intraday Stochastic Trading System – Backtest Report
| Parameter | Value |
|---|---|
| Nifty | |
| Initial Capital | 200000 |
| Final Capital | 1342878.53 |
| Scrip Name | NSE Nifty |
| Backtest Period | 01-Jan-2014 to 20-Nov-2017 |
| Timeframe | 5 Minutes |
| Net Profit % | 571.44% |
| Annual Return % | 62.64% |
| Number of Trades | 265 |
| Winning Trade % | 56.60% |
| Average holding Period | 31.57 periods |
| Max consecutive losses | 5 |
| Max system % drawdown | -22.90% |
| Max Trade % drawdown | -9.32% |
Download the comprehensive backtest report here.
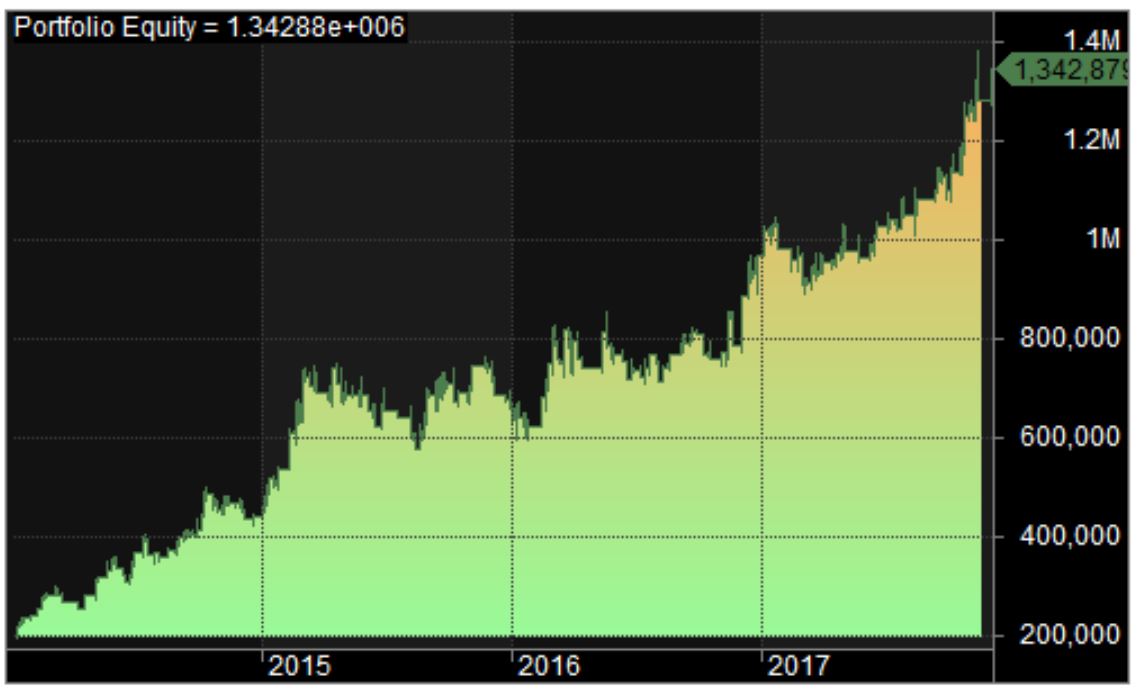
Equity Curve
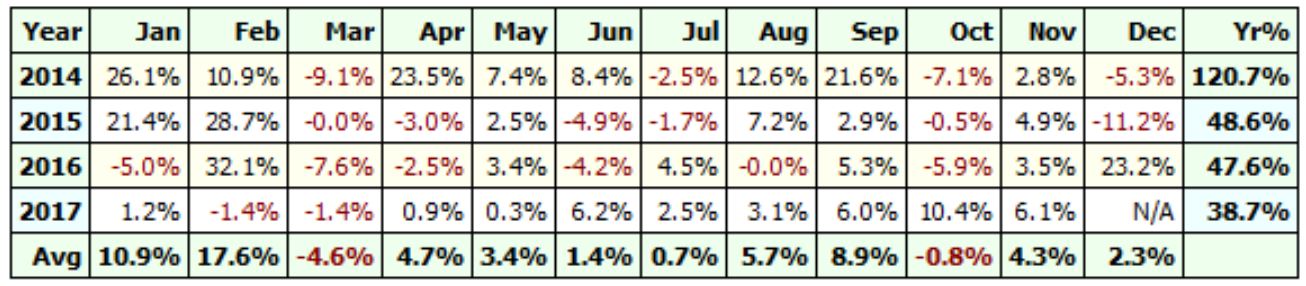
Profit Table
This intraday trend following strategy has turned a profit each year from 2014 to 2017.
 Additional Amibroker Settings for Backtesting
Navigate to Symbol–>Information, and specify the lot size and margin requirement. The below screenshot shows a lot size of 75 and a margin requirement of 10% for NSE Nifty: