

AFL Screenshot

Backtest Report for the Volume Breakout Trading Strategy
| Parameter | Value |
| BankNifty | |
| Initial Capital | 200,000 |
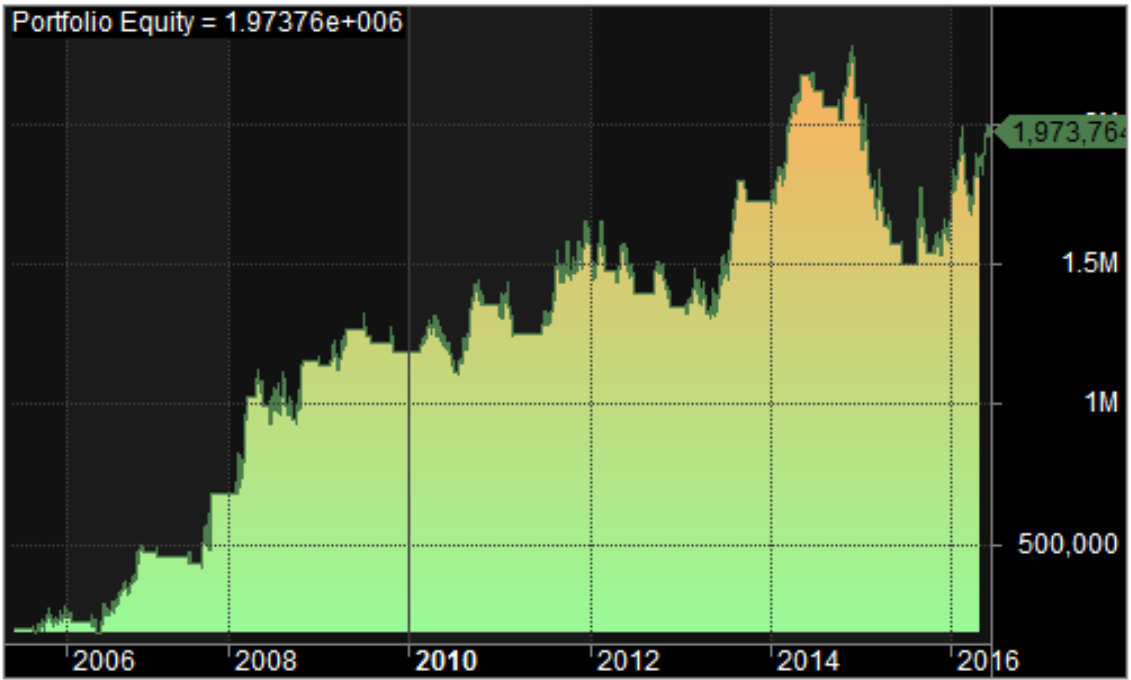
| Final Capital | 1,973,764.04 |
| Scrip Name | NSE Banknifty |
| Backtest Period | 25-Aug-2005 to 17-June-2016 |
| Timeframe | Daily |
| Net Profit % | 886.88% |
| Annual Return % | 23.09% |
| Number of Trades | 78 |
| Winning Trade % | 37.18% |
| Average Holding Period | 19.28 periods |
| Maximum Consecutive Losses | 10 |
| Maximum System % Drawdown | -34.03% |
| Maximum Trade % Drawdown | -75.56% |
The backtest report reveals that the drawdown is relatively high. To mitigate this risk, you can implement effective Risk Management strategies. You can also download the comprehensive backtest report here.
Equity Curve
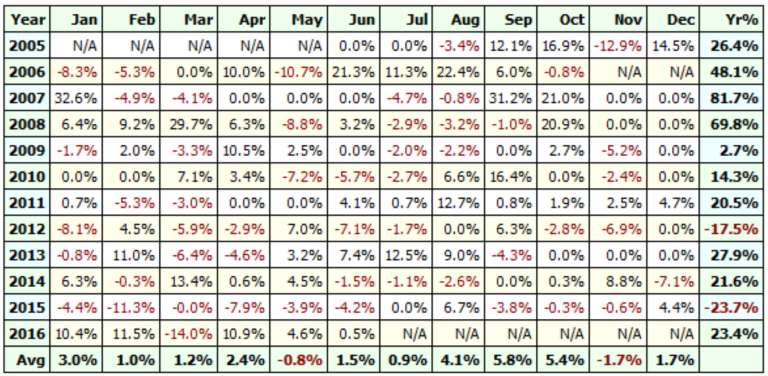
Profit Table
This volume breakout trading strategy has proven to be profitable in all years except for 2015 and 2012.
Additional AmiBroker Settings for Backtesting
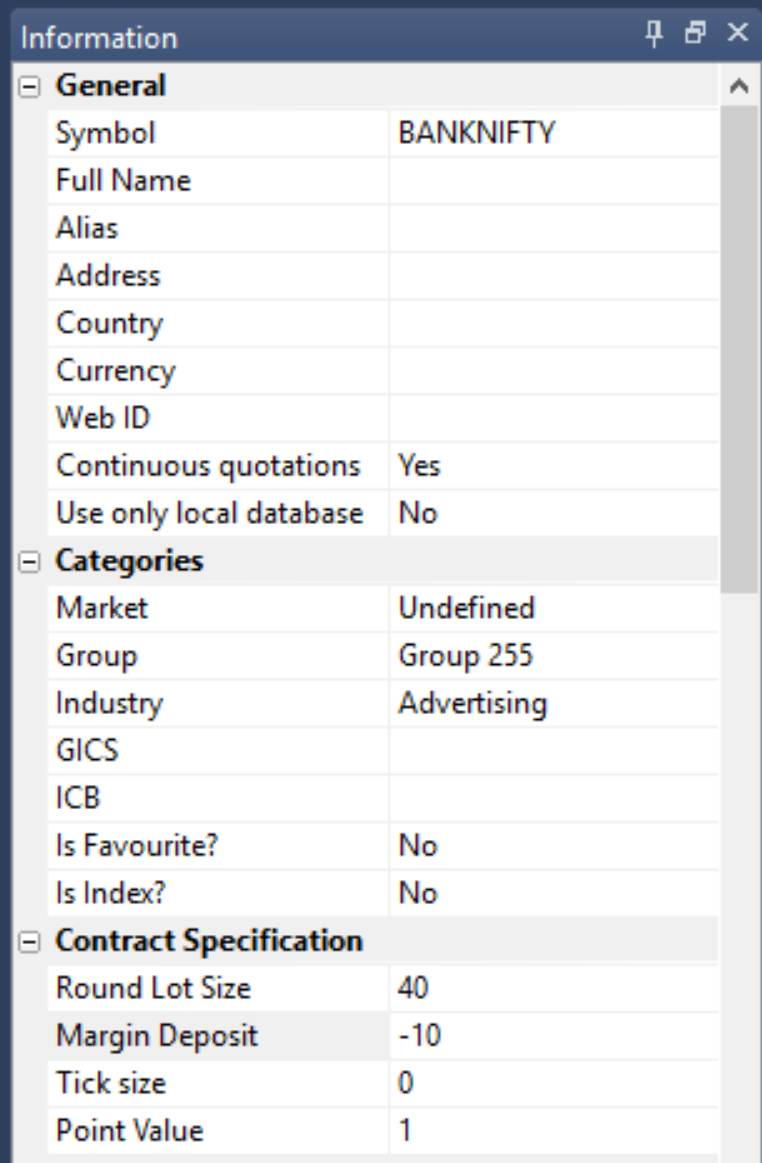
For more accurate backtesting, navigate to Symbol–>Information and specify the lot size and margin requirements. In the screenshot below, you can see a lot size of 40 and a margin requirement of 10% for NSE BankNifty:


2 Comments