
Exploring Live Stock Chart Plotting with Python
In this tutorial, we will explore how to create live stock chart plotting with python. In previous tutorials, we used the Google API to fetch data, but Google’s API has recently been deprecated. Furthermore, the Yahoo Finance API is no longer available. To obtain stock data, we will utilize the Alpha Vantage API in this script. This API is free, and it can retrieve real-time and historical data from major global exchanges. You can review the API documentation here. If you’re interested in more Python-related tutorials, you can find them here.Prerequisites
To get started, you need to generate an API key from the Alpha Vantage website. Obtain the API key through this link.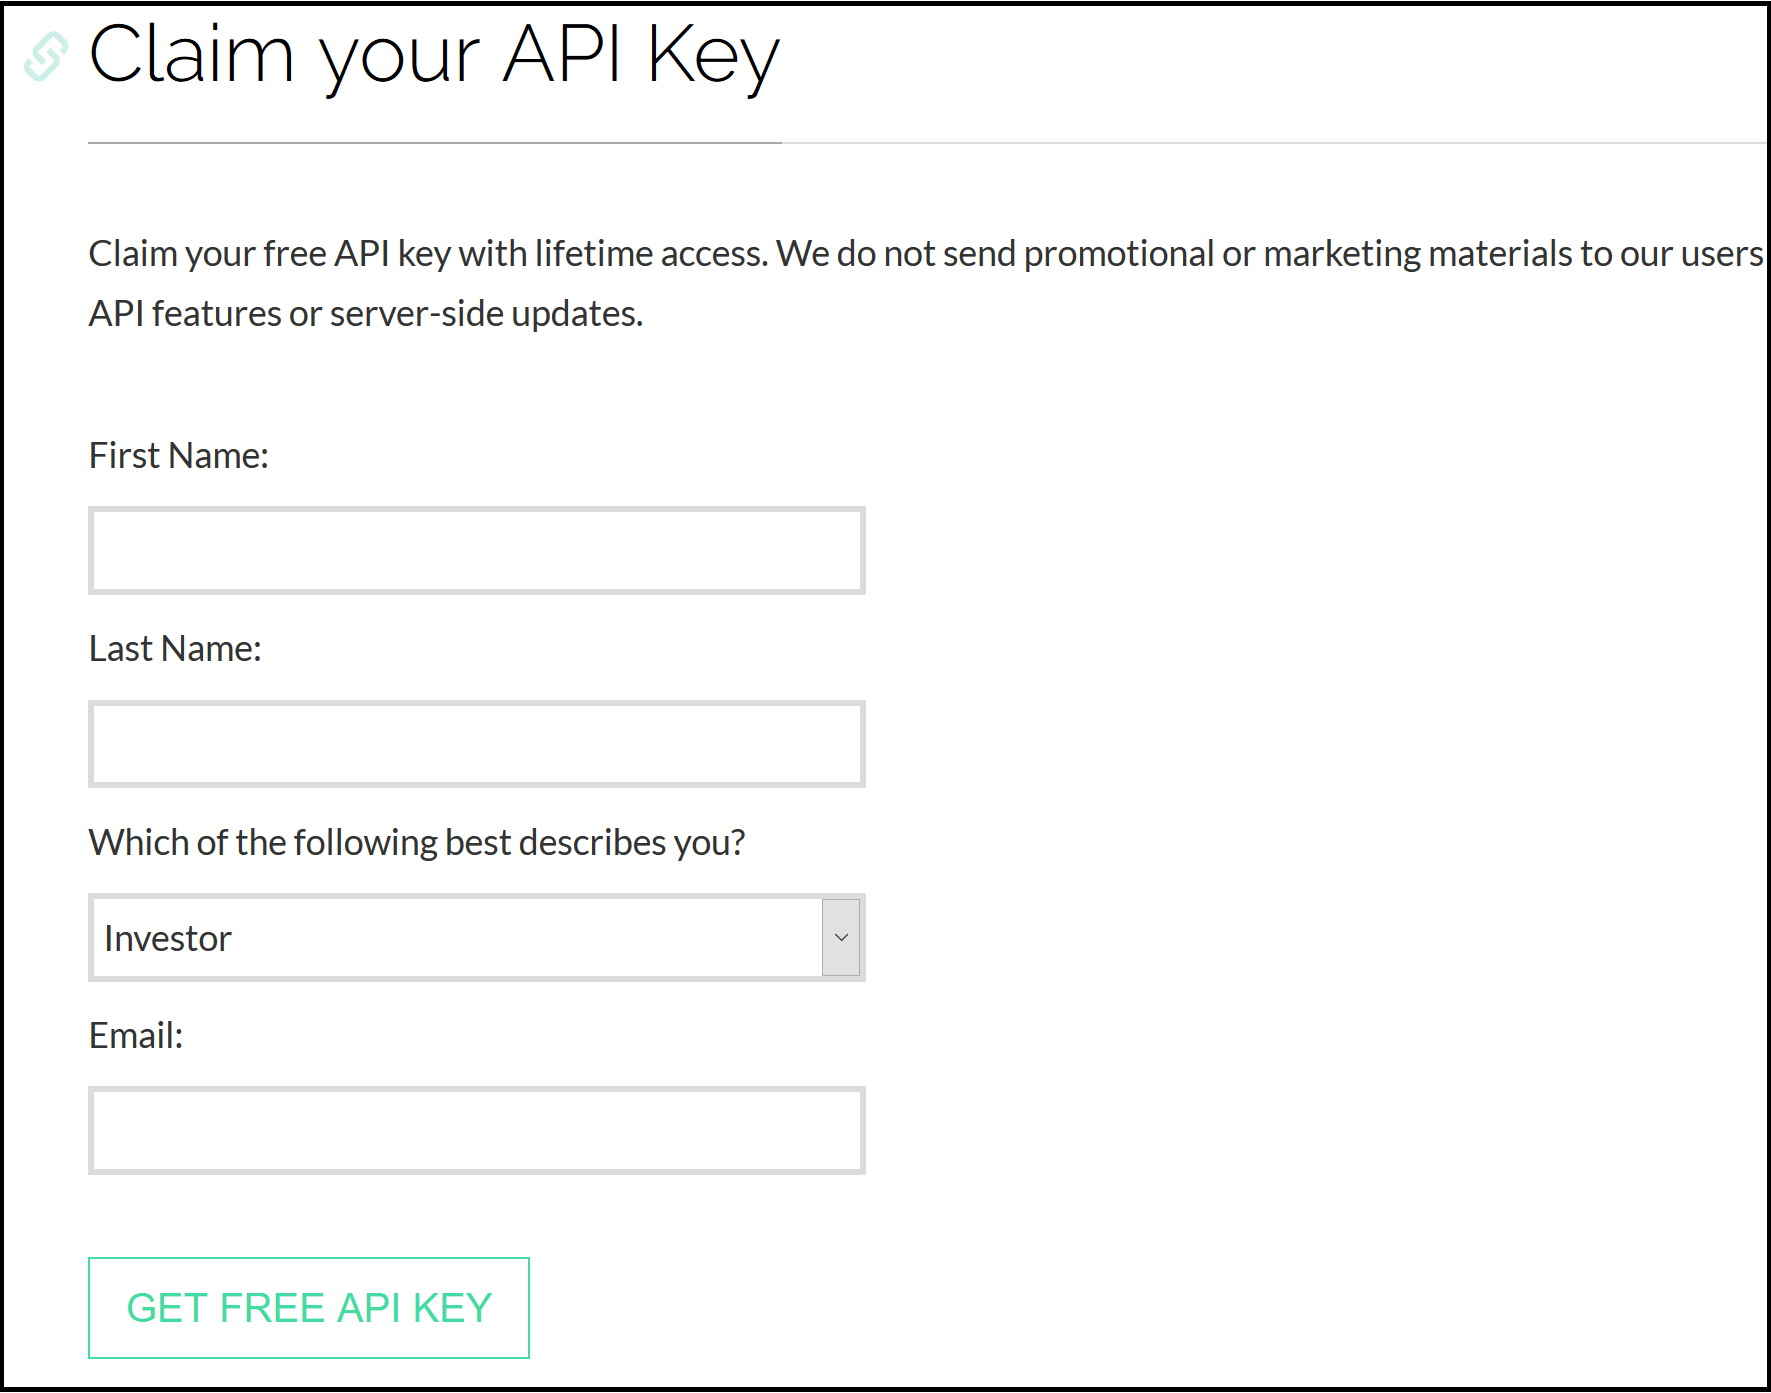 Once you’ve generated the API key, open the command prompt and execute the following commands one by one to install the alpha_vantage and matplotlib modules:
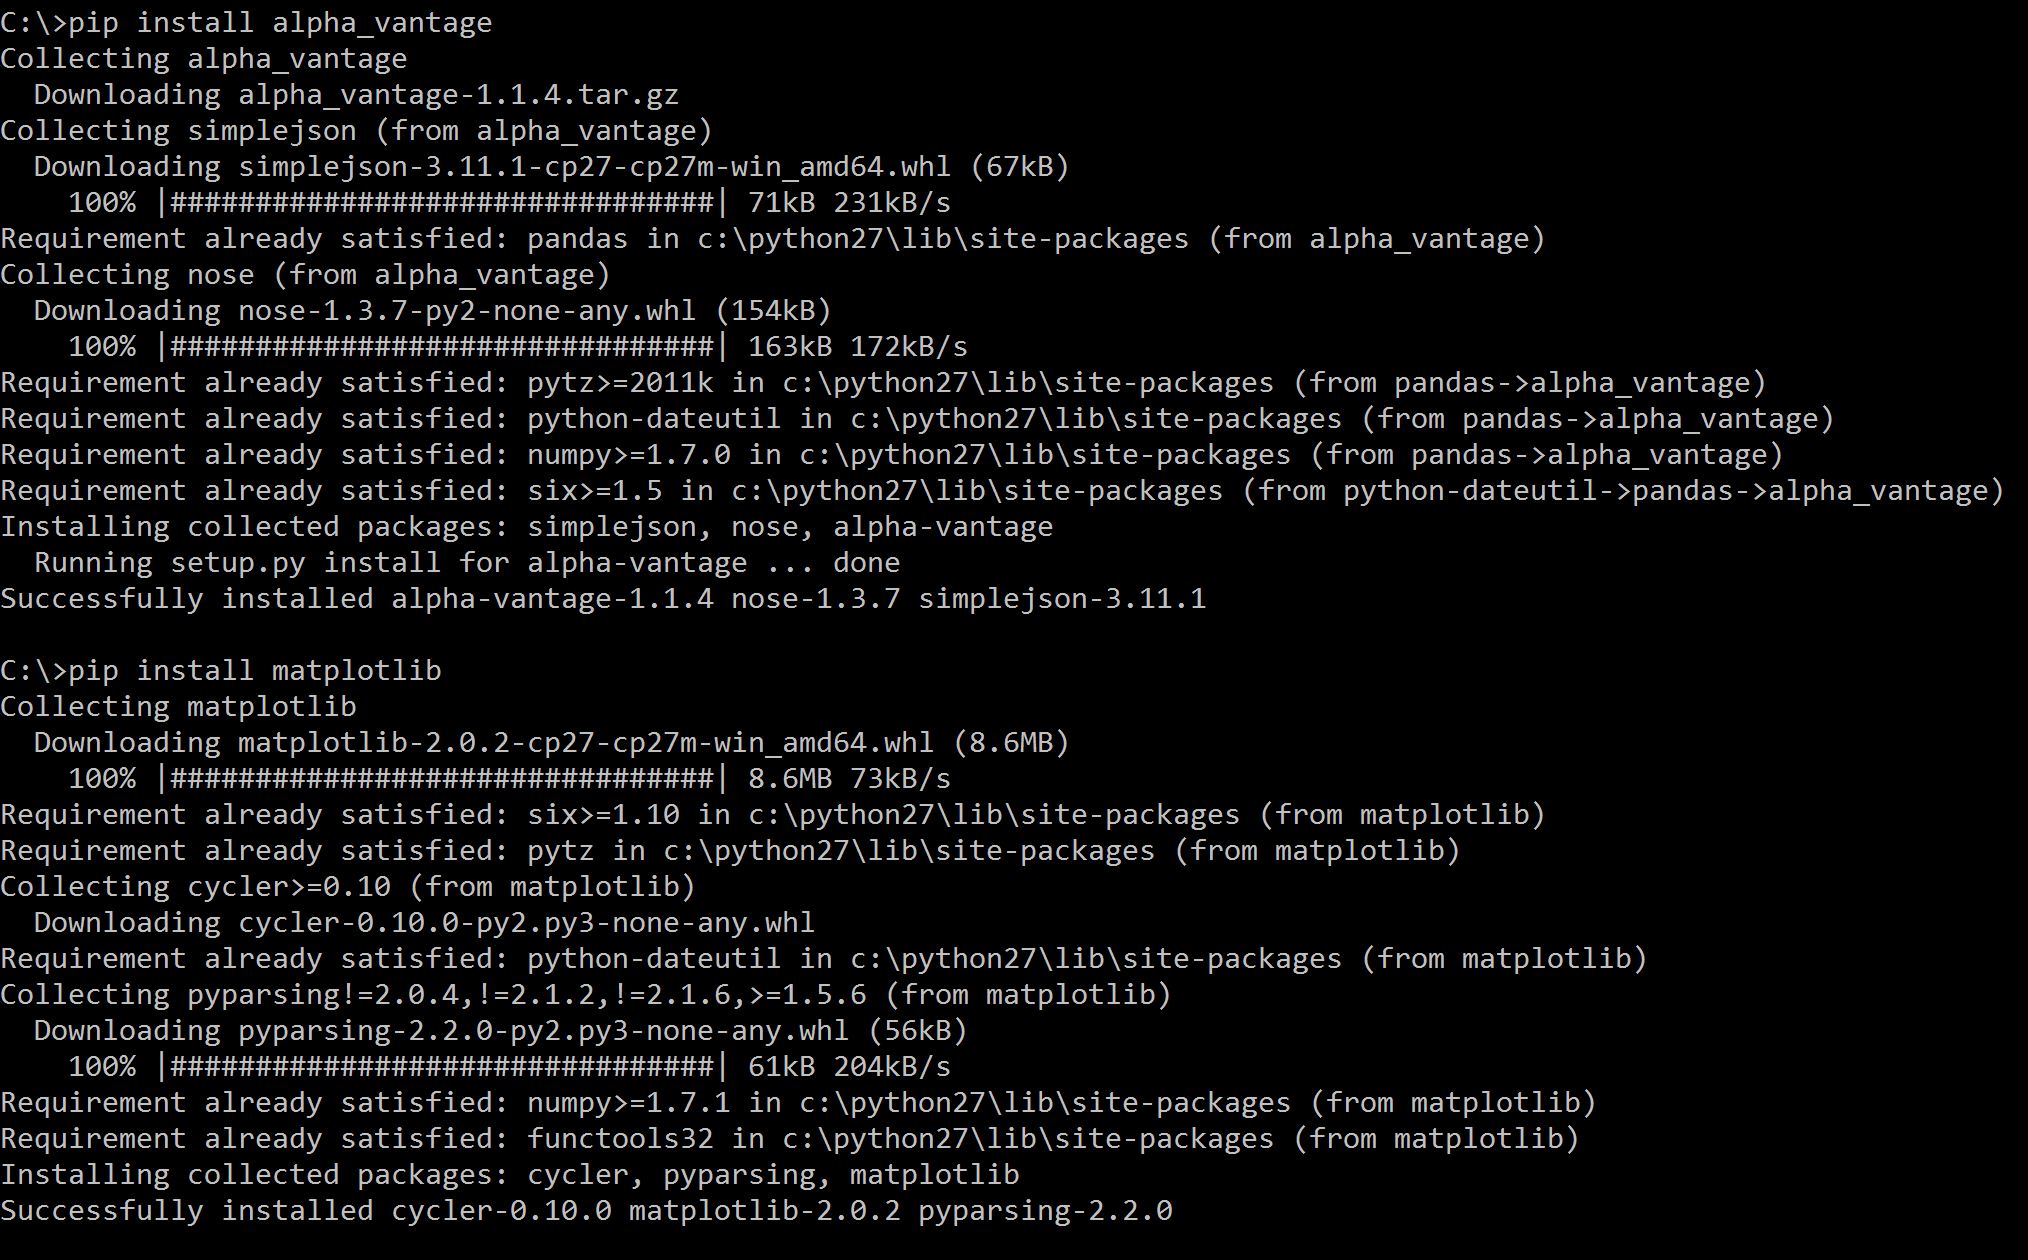
Python Script for Live Stock Chart
Below is the output of this script when executed from PyCharm:
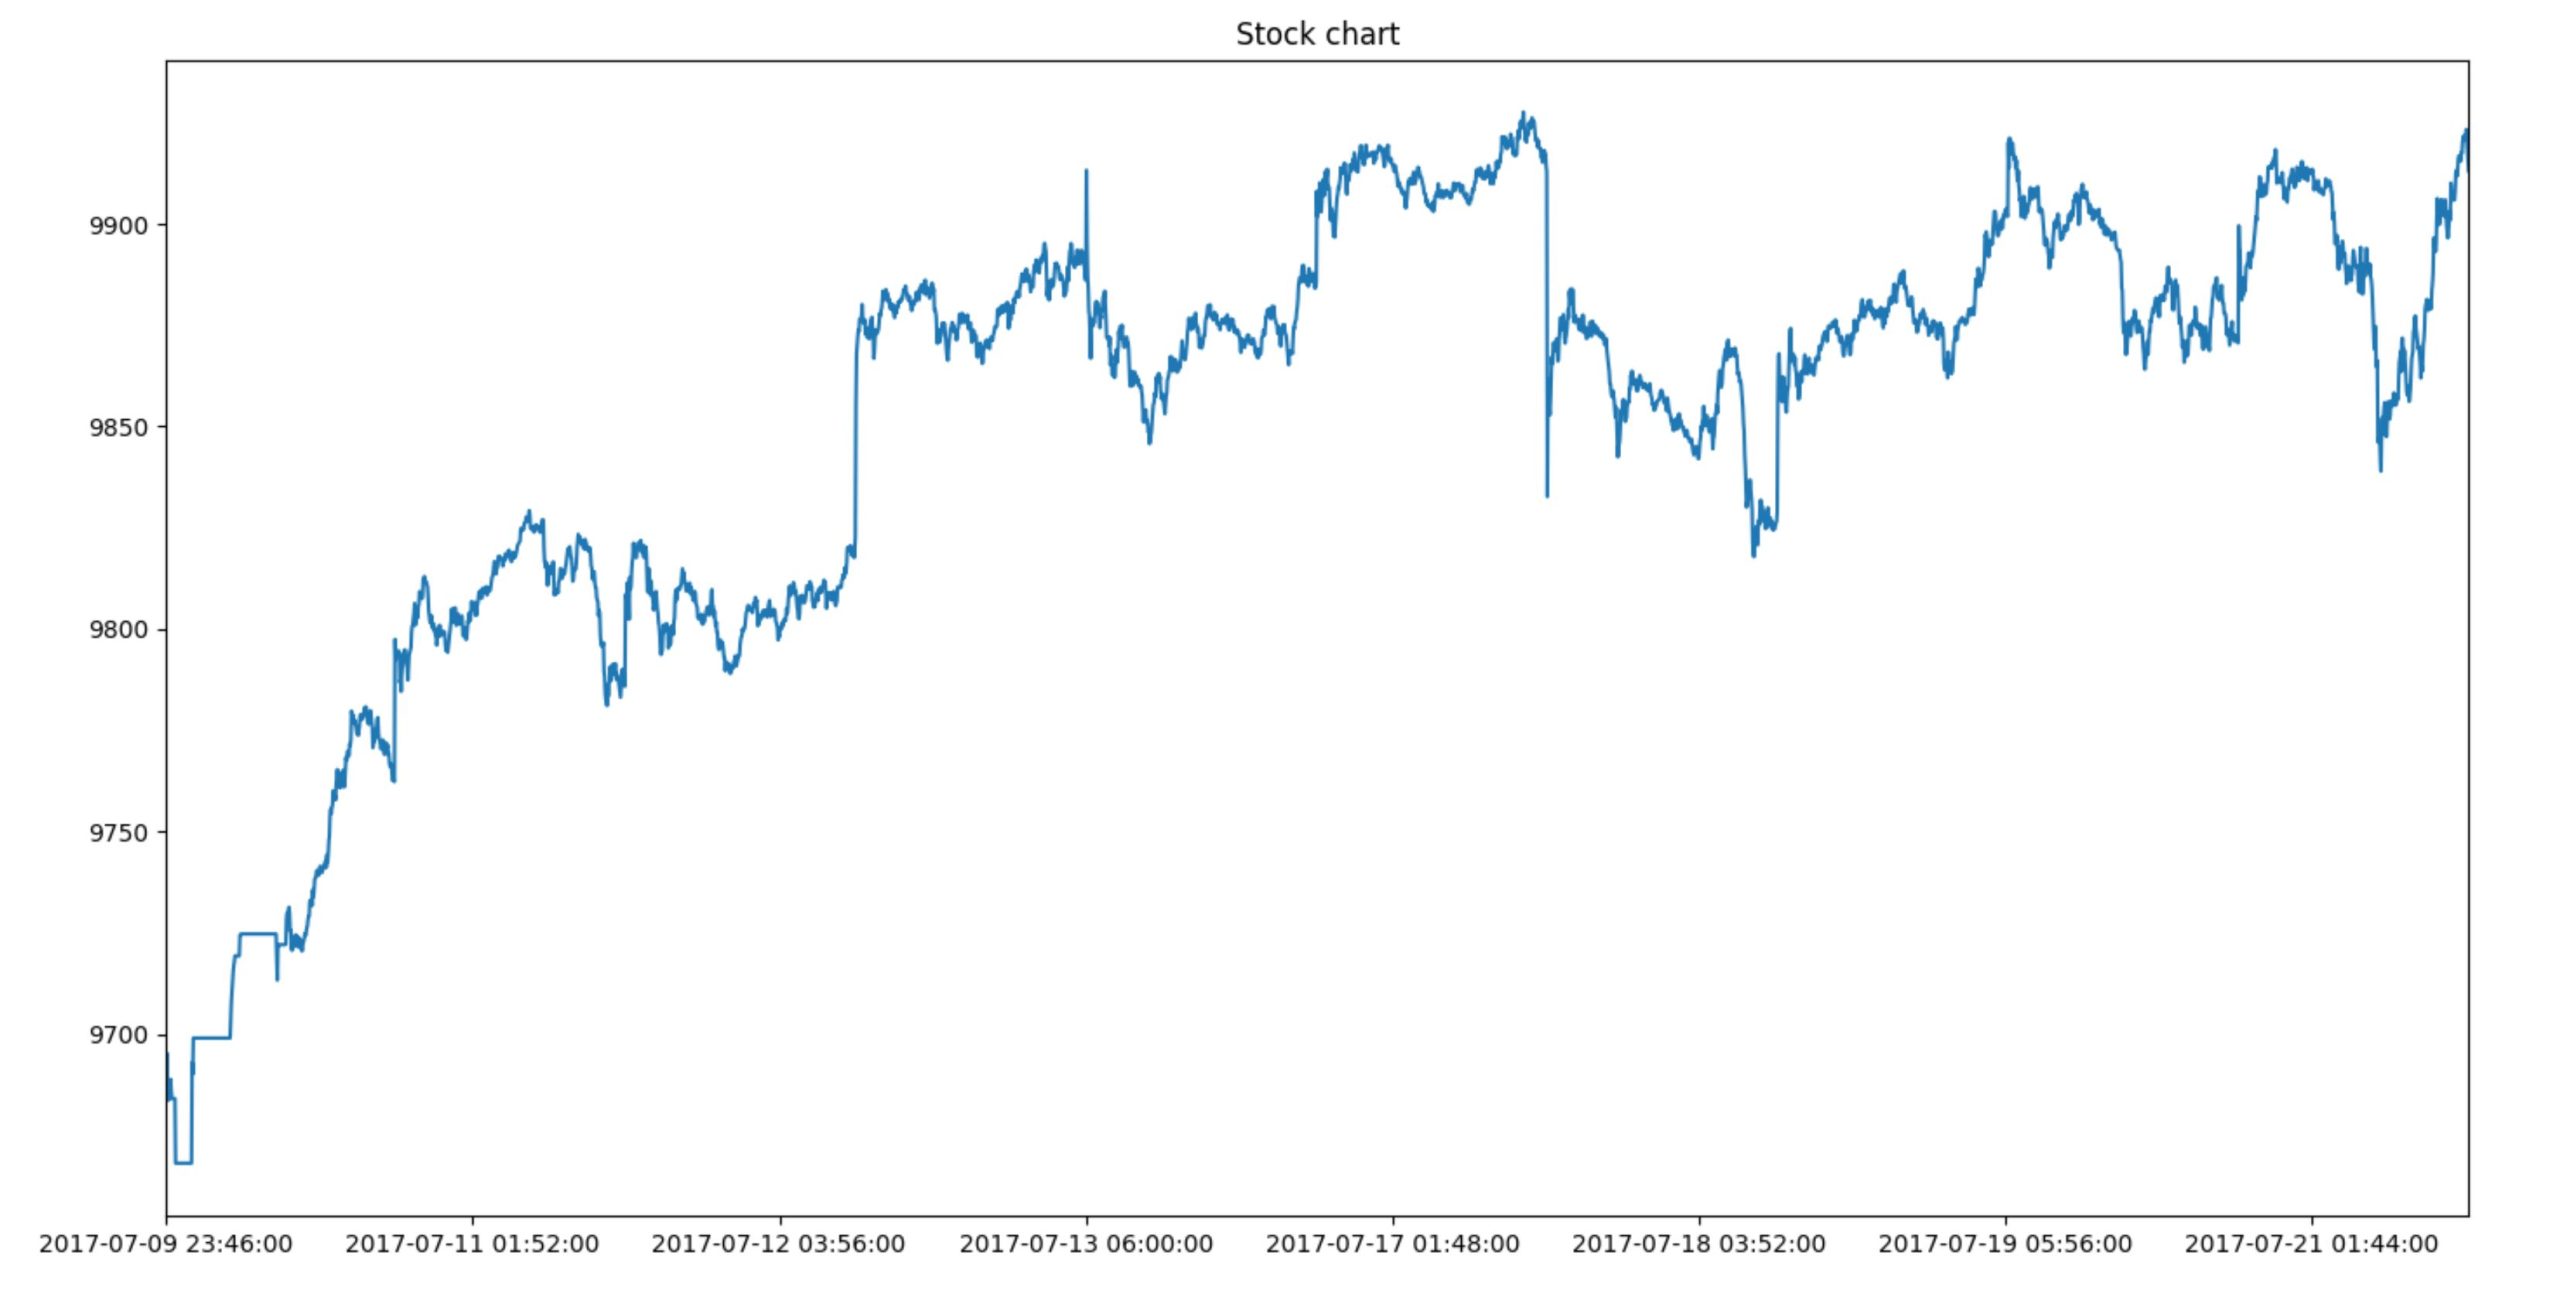
In the lower-left corner of the output screen, you can find options to zoom in, zoom out, and scroll through the chart.
Now, let’s dive into the code logic and see how it functions.
The initial import statements allow us to use the modules we installed in the previous step. Next, there’s a function for fetching intraday data for the entered symbol. Note that we are using the API key value from Alpha Vantage. Finally, a line chart is generated using the ‘close’ values from the time series. You can similarly plot open, high, low, and volume data.
You can explore the Alpha Vantage API documentation, which offers numerous features you can leverage. The best part is that API usage is entirely free, a rarity in the industry. Feel free to ask any questions in the comments section.