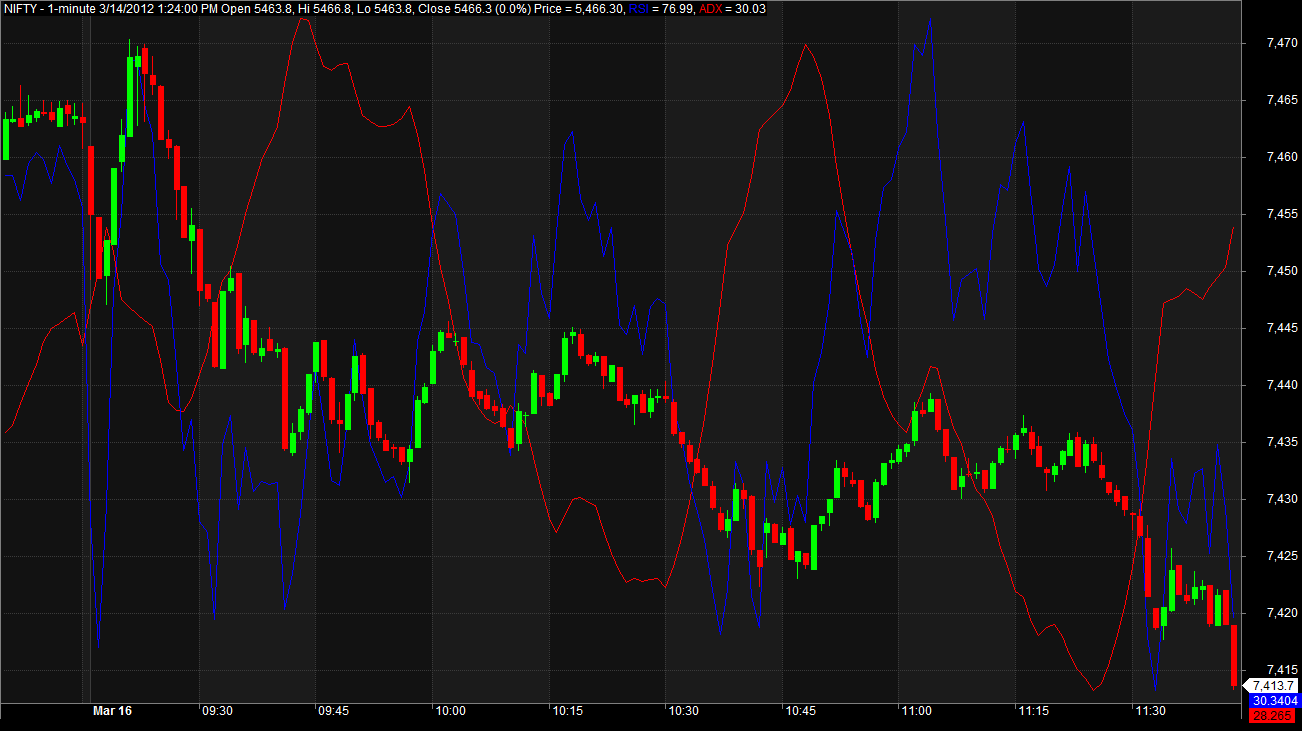
Presenting an exceptional Intraday trading strategy here. This strategy leverages the RSI and ADX combination to identify Buy/Sell opportunities.

Contrary to conventional wisdom, we Buy when RSI crosses the upper limit and Sell when it crosses the lower limit. ADX serves as a trend identifier in our decision-making process. All positions are closed at the end of the day.

Explore more on AFL coding to create your personalized trading systems.

AFL Overview


Parameter Value
Preferred Timeframe Intraday 1 minute
Indicators Used RSI(17), ADX(14)
Buy Condition RSI(17) >= 75 AND ADX(14) > 25
Short Condition RSI(17) <= 25 AND ADX(14) > 25
Sell Condition Same as Short Condition OR Time >= 03:15 PM
Cover Condition Same as Cover Condition OR Time >= 03:15 PM
Stop Loss 0.5%
Targets No fixed target, Stop and reverse when AFL gives the opposite signal
Position Size 150 (fixed) or 80% of equity (based on your risk appetite)
Initial Equity 200,000
Brokerage 50 per order
Margin 10%
				
					//------------------------------------------------------
//
//  Formula Name:    Nifty Intraday Strategy using RSI and ADX
//  Website:         zerobrokerageclub.com
//------------------------------------------------------
_SECTION_BEGIN("Nifty Intraday Strategy");
SetTradeDelays( 1, 1, 1, 1 );
SetOption( "InitialEquity", 200000);
SetOption("FuturesMode" ,True);
SetOption("MinShares",1);
SetOption("CommissionMode",2);
SetOption("CommissionAmount",50);
SetOption("AccountMargin",10);
SetOption("RefreshWhenCompleted",True);
SetPositionSize(150,spsShares); //Use this for fixed position size
//SetPositionSize(80,spsPercentOfEquity); //Use this for position size as a percent of Equity
SetOption( "AllowPositionShrinking", True );
BuyPrice=Open;
SellPrice=Open;
ShortPrice=Open;
CoverPrice=Open;
SetChartOptions(0,chartShowArrows|chartShowDates);
_N(Title = StrFormat("{{NAME}} – {{INTERVAL}} {{DATE}} Open %g, Hi %g, Lo %g, Close %g (%.1f%%) {{VALUES}}", O, H, L, C, SelectedValue( ROC( C, 1 ) ) ));
Plot( Close, "Price", colorWhite, styleCandle );
RSIPeriods=17;
ADXPeriods=14;
Buy=RSI(RSIPeriods)>=75 AND ADX(ADXPeriods)>25;
Short=RSI(RSIPeriods)<=25 AND ADX(ADXPeriods)>25 ;
Buy=ExRem(Buy,Short);
Short=ExRem(Short,Buy);
Sell=Short OR TimeNum()==151500;
Cover=Buy OR TimeNum()==151500;
StopLoss=0.5;
ApplyStop(Type=0,Mode=1,Amount=StopLoss);
Plot( RSI(RSIPeriods), "RSI", color=colorBlue, ParamStyle( "Style", styleOwnScale) );
Plot( ADX(ADXPeriods), "ADX", color=colorRed, ParamStyle( "Style", styleOwnScale) );
/* Plot Buy and Sell Signal Arrows */
PlotShapes(IIf(Buy, shapeSquare, shapeNone),colorGreen, 0, L, Offset=-40);
PlotShapes(IIf(Buy, shapeSquare, shapeNone),colorLime, 0,L, Offset=-50);
PlotShapes(IIf(Buy, shapeUpArrow, shapeNone),colorWhite, 0,L, Offset=-45);
PlotShapes(IIf(Cover, shapeSquare, shapeNone),colorGreen, 0, L, Offset=-40);
PlotShapes(IIf(Cover, shapeSquare, shapeNone),colorLime, 0,L, Offset=-50);
PlotShapes(IIf(Cover, shapeUpArrow, shapeNone),colorWhite, 0,L, Offset=-45);
PlotShapes(IIf(Sell, shapeSquare, shapeNone),colorRed, 0, H, Offset=40);
PlotShapes(IIf(Sell, shapeSquare, shapeNone),colorOrange, 0,H, Offset=50);
PlotShapes(IIf(Sell, shapeDownArrow, shapeNone),colorWhite, 0,H, Offset=-45);
PlotShapes(IIf(Short, shapeSquare, shapeNone),colorRed, 0, H, Offset=40);
PlotShapes(IIf(Short, shapeSquare, shapeNone),colorOrange, 0,H, Offset=50);
PlotShapes(IIf(Short, shapeDownArrow, shapeNone),colorWhite, 0,H, Offset=-45);
_SECTION_END();


AFL Screenshot

Nifty-Intraday-Strategy

Backtest Report

Below is the backtest report for two different variations of this strategy. One employs a fixed position size of 150, while the other adjusts position size as a percentage of Equity. Notably, the second one outperforms the first, illustrating  The Magic of Compounding.

Can you calculate the Final capital for the second one? Give it a try!

Moral of the Story: Profitable strategies need not be complex or lengthy.

Parameter Value
Fixed Position Size Position Size = 80% of Equity
Initial Capital 200,000 200,000
Final Capital 1,439,280.45 11,219,716,562.40
Backtest Period 01-Jan-2008 to 22-03-2016 01-Jan-2008 to 22-03-2016
Timeframe 1 Minute 1 Minute
Net Profit % 619.64% 5,609,758.28%
Annual Return % 27.10% 277.59%
Number of Trades 1,913 1,913
Winning Trade % 43.49% 43.49%
Average Holding Period 128.08 periods 128.08 periods
Max Consecutive Losses 12 12
Max System % Drawdown -18.14% -31.51%
Max Trade % Drawdown -31.51% -44.43%

Download the detailed backtest report here.
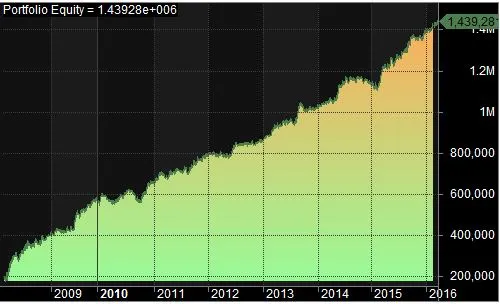
Equity Curve

This strategy boasts a smooth and linear equity curve with minimal drawdowns. Take a look.

Equity-Curve_Nifty-Intraday

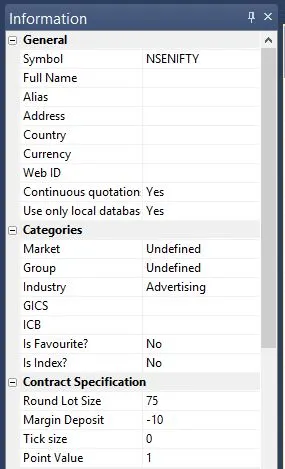
Additional Amibroker settings for backtesting

Visit Symbol–>Information to specify the lot size and margin requirement. The screenshot below illustrates a lot size of 75 and a margin requirement of 10% for NSE Nifty:

Symbol-Info_Nifty

One Comment

Leave a Reply