
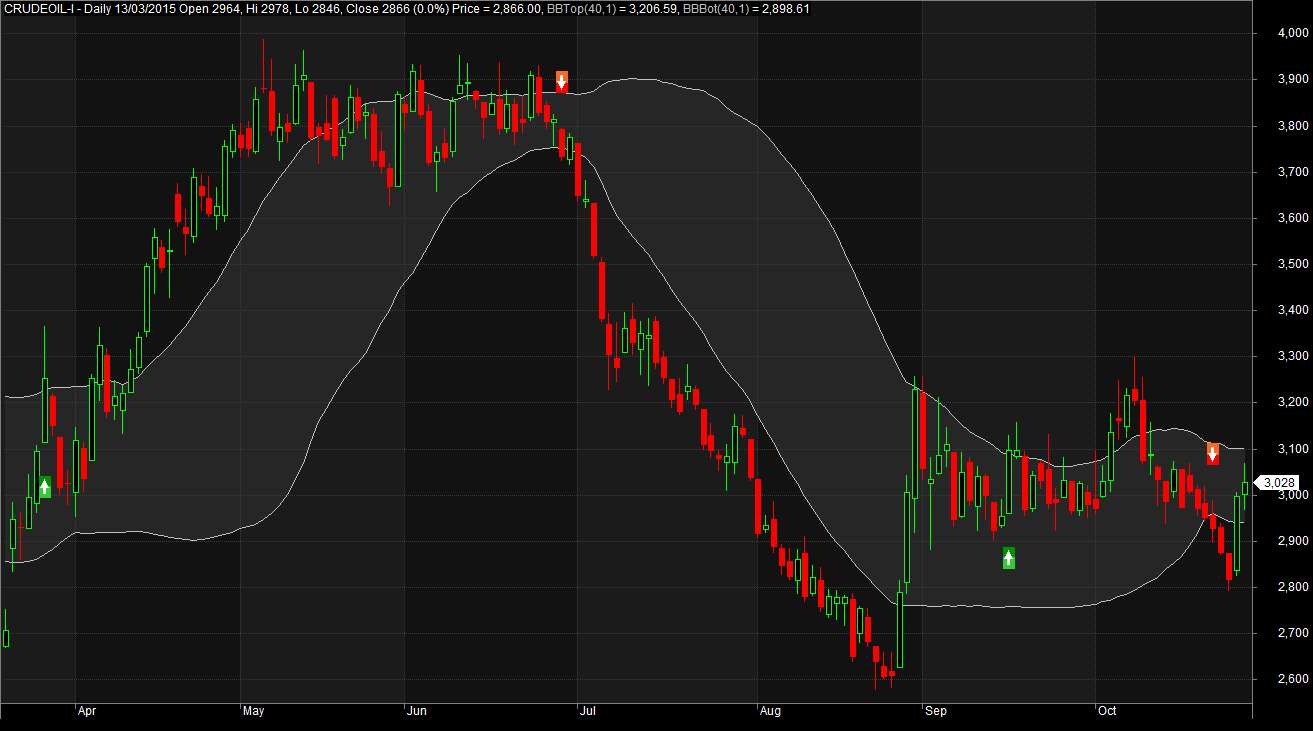
AFL Screenshot
Backtest Report
| Parameter | Value |
| Fixed Position Size | |
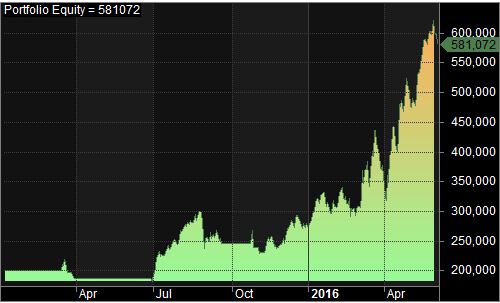
| Initial Capital | 200,000 |
| Final Capital | 581,072 |
| Scrip Name | MCX Crude Oil Futures |
| Backtest Period | 16-Mar-2015 to 03-June-2016 |
| Timeframe | Daily |
| Net Profit % | 190.54% |
| Annual Return % | 111.72% |
| Number of Trades | 8 |
| Winning Trade % | 37.50% |
| Average Holding Period | 27.50 periods |
| Max Consecutive Losses | 3 |
| Max System % Drawdown | -26.97% |
| Max Trade % Drawdown | -42.07% |
This Crude Oil Trading strategy exhibits slightly higher drawdown figures. Nevertheless, it remains profitable over the long term. Access the comprehensive backtest report here.
Equity Curve
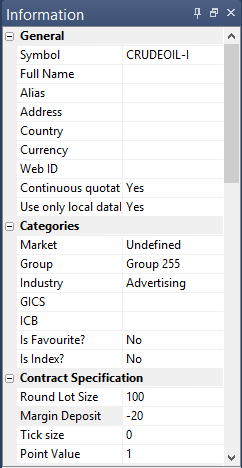
Additional Amibroker settings for backtesting
Go to Symbol–>Information and specify the lot size and margin requirement. The screenshot below illustrates a lot size of 100 and a margin requirement of 20% for Crude Oil Futures:


2 Comments