

The Golden Cross and Death Cross are highly favored strategies in trend-following trading systems. You may have encountered these terms if you’ve enrolled in a technical analysis course or tutorial. Even if you haven’t, we’re here to explain these concepts and their practical application. In this post, we also provide an Excel sheet that allows you to backtest them on any stock or index. Please continue reading below.
Explore more of our Excel-based trading strategies here.
What is Golden Cross and Death Cross?
The Golden Cross and Death Cross are significant points in a stock or index’s technical chart, indicating trend reversals. They are based on moving average crossovers. The general rule is that a stock gives a Buy signal when the faster-moving average crosses above the slower-moving average, while it gives a Sell signal when the faster-moving average crosses below the slower-moving average. The Golden Cross occurs when the 50-day simple moving average crosses above the 200-day moving average, and the Death Cross occurs when the 50-day moving average crosses below the 200-day moving average. Either crossover carries more weight when accompanied by high trading volume. It’s as straightforward as that! This strategy works effectively on a majority of indices and stocks over the long term.
Strategy Overview
| Parameter | Value |
| Preferred Timeframe | Daily |
| Indicators Used | 50 Days SMA, 200 Days SMA |
| Buy Condition | 50 Days SMA is above 200 Days SMA |
| Short Condition | 50 Days SMA is below 200 Days SMA |
| Stop Loss | No fixed stop loss; stop and reverse when Excel gives the opposite signal |
| Targets | No fixed target; stop and reverse when Excel gives the opposite signal |
Excel Sheet
| Parameter | Description | |
| Worksheet Name | Golden Cross and Death Cross | |
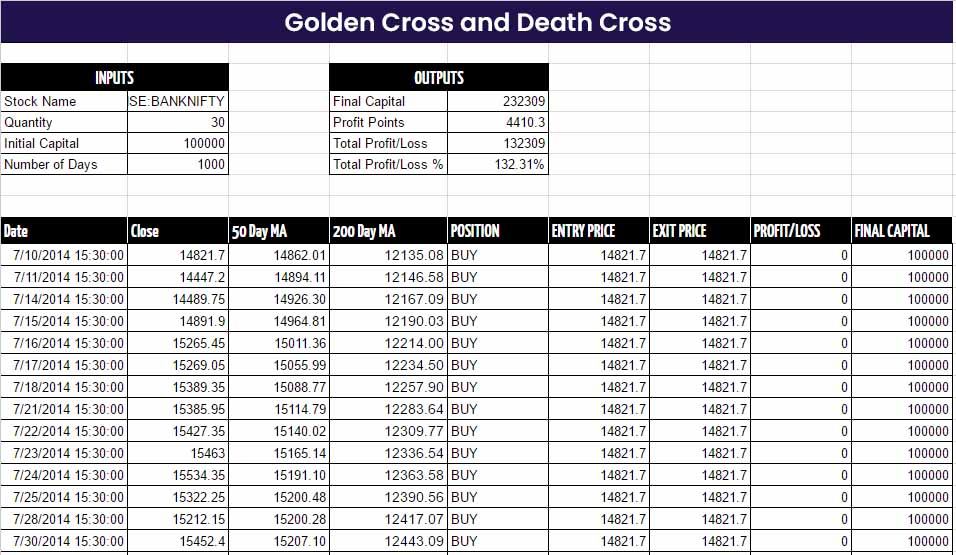
| Inputs | Stock Name (B4) | Name of the Stock or Index. Example: NSE:NIFTY, NASDAQ:AAPL |
| Quantity (B5) | Number of shares to Buy when Golden Cross or Death Cross occurs | |
| Initial Capital (B6) | Your initial trading capital | |
| Number of Days (B7) | Number of days to backtest this system | |
| Outputs | Final Capital (E4) | Final capital after the backtest period |
| Profit Points (E5) | Total points earned | |
| Total Profit/Loss (E6) | Total profit/loss in exact terms | |
| Total Profit/Loss % (E7) | Total profit/loss in percentage terms | |
Screenshot
Step 1: Open the sheet from the provided link at the end of this post.
Step 2: Enter inputs in Cells B4 to B7. Ensure you are connected to the internet.
Step 3: Wait for approximately 30 seconds. The sheet will update automatically based on the inputs you provided.
Step 4: Check the outputs in Cells E4 to E7.
Step 5: Take Buy/Short positions based on the signals in the Position column.
Here is the link to the Google Sheets document where you can edit it online without the need to download it to your local machine.


One Comment