How to Use the CCI Trading System?
Step 1: Copy the AFL code provided and set it up in your local Amibroker software.
Step 2: Download and set up End-of-Day (EOD) data for your preferred stock exchange.
Step 3: In the Amibroker software, go to the “Analysis” menu and select “Explore.” In the “Range” dropdown, choose “1 recent bar.”
Step 4: In the results, you’ll see the Trend score for each script. A trend score above 5 indicates bullish stocks, while a score below 2 points to bearish stocks.
AFL Screenshot
Unlock the CCI Trading System’s Potential – Backtest Report
The CCI Trading System consistently delivers excellent results. With a modest drawdown rate, it’s well-suited for mildly aggressive traders. Achieving a 20% Compound Annual Growth Rate (CAGR) over the last six years bodes well for long-term capital growth.
| Parameter | Value |
| Nifty | |
| Initial Capital | 200,000 |
| Final Capital | 772,617.80 |
| Scrip Name | NSE Nifty |
| Backtest Period | 01-Jan-2010 to 24-Apr-2017 |
| Timeframe | Daily |
| Net Profit % | 286.31% |
| Annual Return % | 20.32% |
| Number of Trades | 99 |
| Winning Trade % | 42.42% |
| Average Holding Period | 7.88 periods |
| Max Consecutive Losses | 6 |
| Max System % Drawdown | -27.43% |
| Max Trade % Drawdown | -37.62% |
Download the detailed backtest report here.
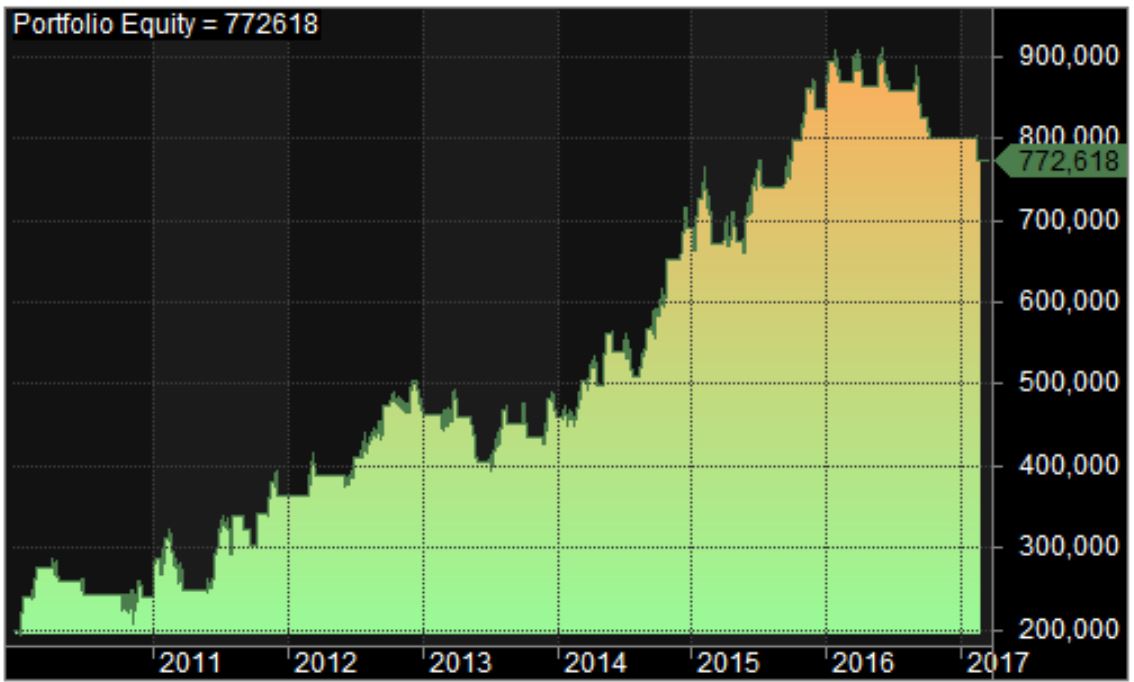
The equity curve, smoother than most trading systems we’ve seen, experiences periods of mild drawdown, which are par for the course for any system.
Equity Curve
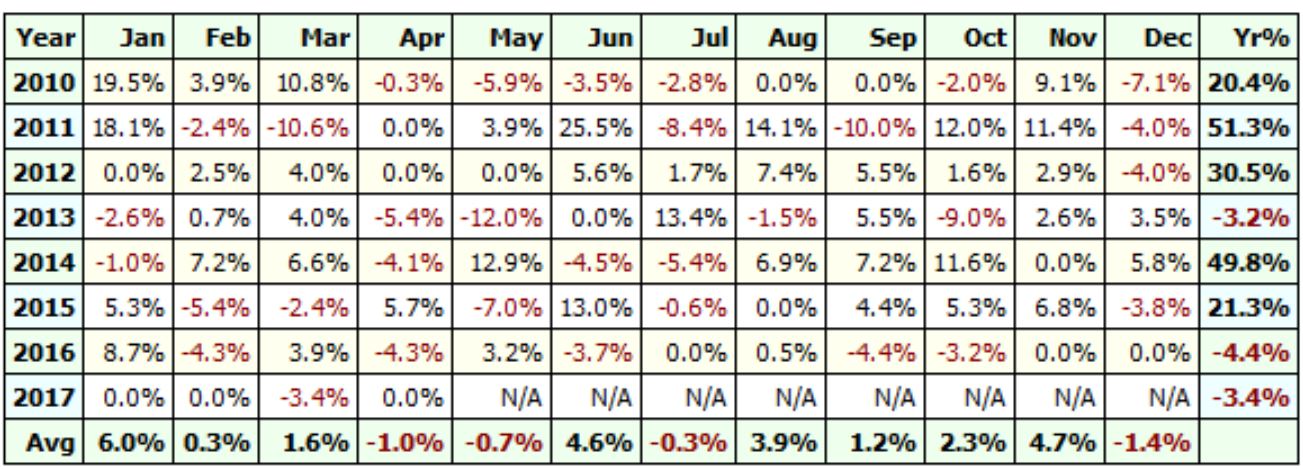
Profit Table
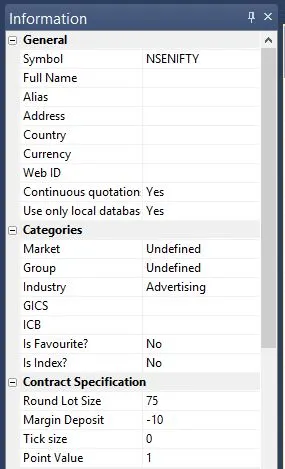
Optimizing Amibroker Settings for Backtesting
Head to “Symbol” –> “Information” and specify the lot size and margin requirement. The screenshot below shows a lot size of 75 and a margin requirement of 10% for NSE Nifty: