Excel’s Dominance in Financial Calculations
When you consider complex financial calculations, ‘Excel’ is usually the first tool that comes to mind. Amidst a variety of tools and software, Excel still stands out for its ease of use and adaptability. In this guide, we will show you how to calculate CAGR in Excel, an essential measure for evaluating the effectiveness of algorithmic trading systems.
Understanding CAGR
Firstly, let’s delve into what CAGR is.
Comprehending CAGR
CAGR, or compounded annual growth rate, indicates the yearly growth rate necessary to expand your investment from its initial amount to its final amount, assuming the profits are reinvested annually.
The formula to calculate CAGR is:
CAGR= (EC/SC)1/n -1
Explanation of terms:
SC – Starting Capital
EC – Ending Capital
N – Number of years
Consider a trading system that elevates your capital from 100K to 200K in 3 years. Then:
CAGR = (200000/100000)1/3 -1 = 0.2599 or 25.99%
Typically shown in percentage terms, CAGR is a key metric for comparing trading system performances, commonly found in backtesting reports on platforms like Amibroker.
Easy CAGR Calculation in Excel
Understanding the above CAGR formula makes calculating it in Excel straightforward.
Depending on available data, there are two approaches:
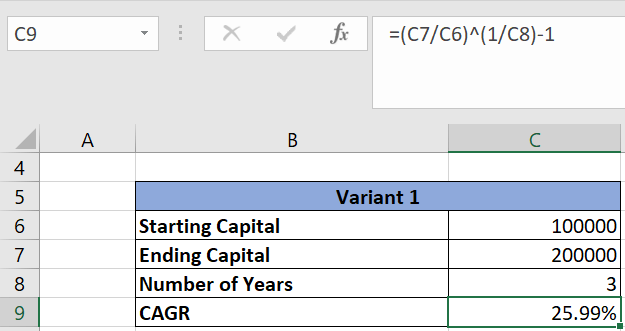
Variant 1: When you know the starting capital, ending capital, and the number of years:

Here, calculate CAGR using the formula =(C7/C6)^(1/C8)-1, where C7 is ending capital, C6 is starting capital, and C8 is the number of years.
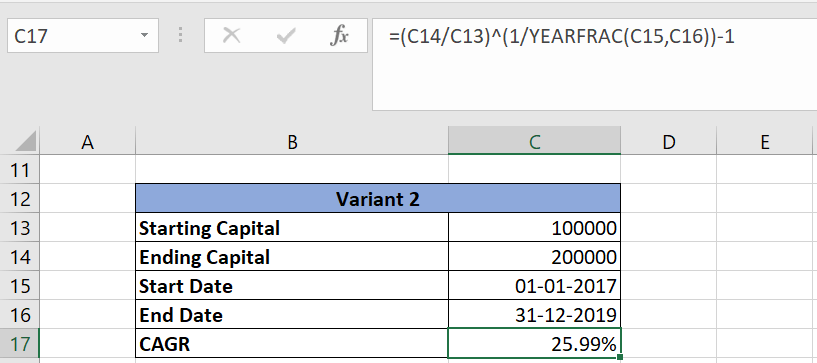
Variant 2: When you have the starting capital, ending capital, start date, and end date:

Calculate CAGR here using =(C14/C13)^(1/YEARFRAC(C15,C16))-1, where C14 is ending capital, C13 is starting capital, C15 is the start year, and C16 is the end year. The formula YEARFRAC internally computes the number of years.
Download the Excel Sheet
To calculate CAGR yourself, download the Excel sheet from the link below:


3 Comments