Heikin-Ashi provides a graphical representation of market trends using a variation of the familiar Japanese candlestick charts. Essentially, Heikin-Ashi is a distinctive type of candlestick where the opening, high, low, and closing (OHLC) values are divergent from conventional candlesticks. The Japanese terms “Heikin” and “Ashi” translate to “average” and “pace”, respectively, thus Heikin-Ashi illustrates the average pace of price values. It crafts a composite candlestick by utilizing the open-close data from the previous span and the open-high-low-close data from the current span. This article unfolds a Heikin Ashi Trading System, coded in Amibroker AFL, that has been optimized for NSE:Banknifty but can be applicable to other instruments as well.
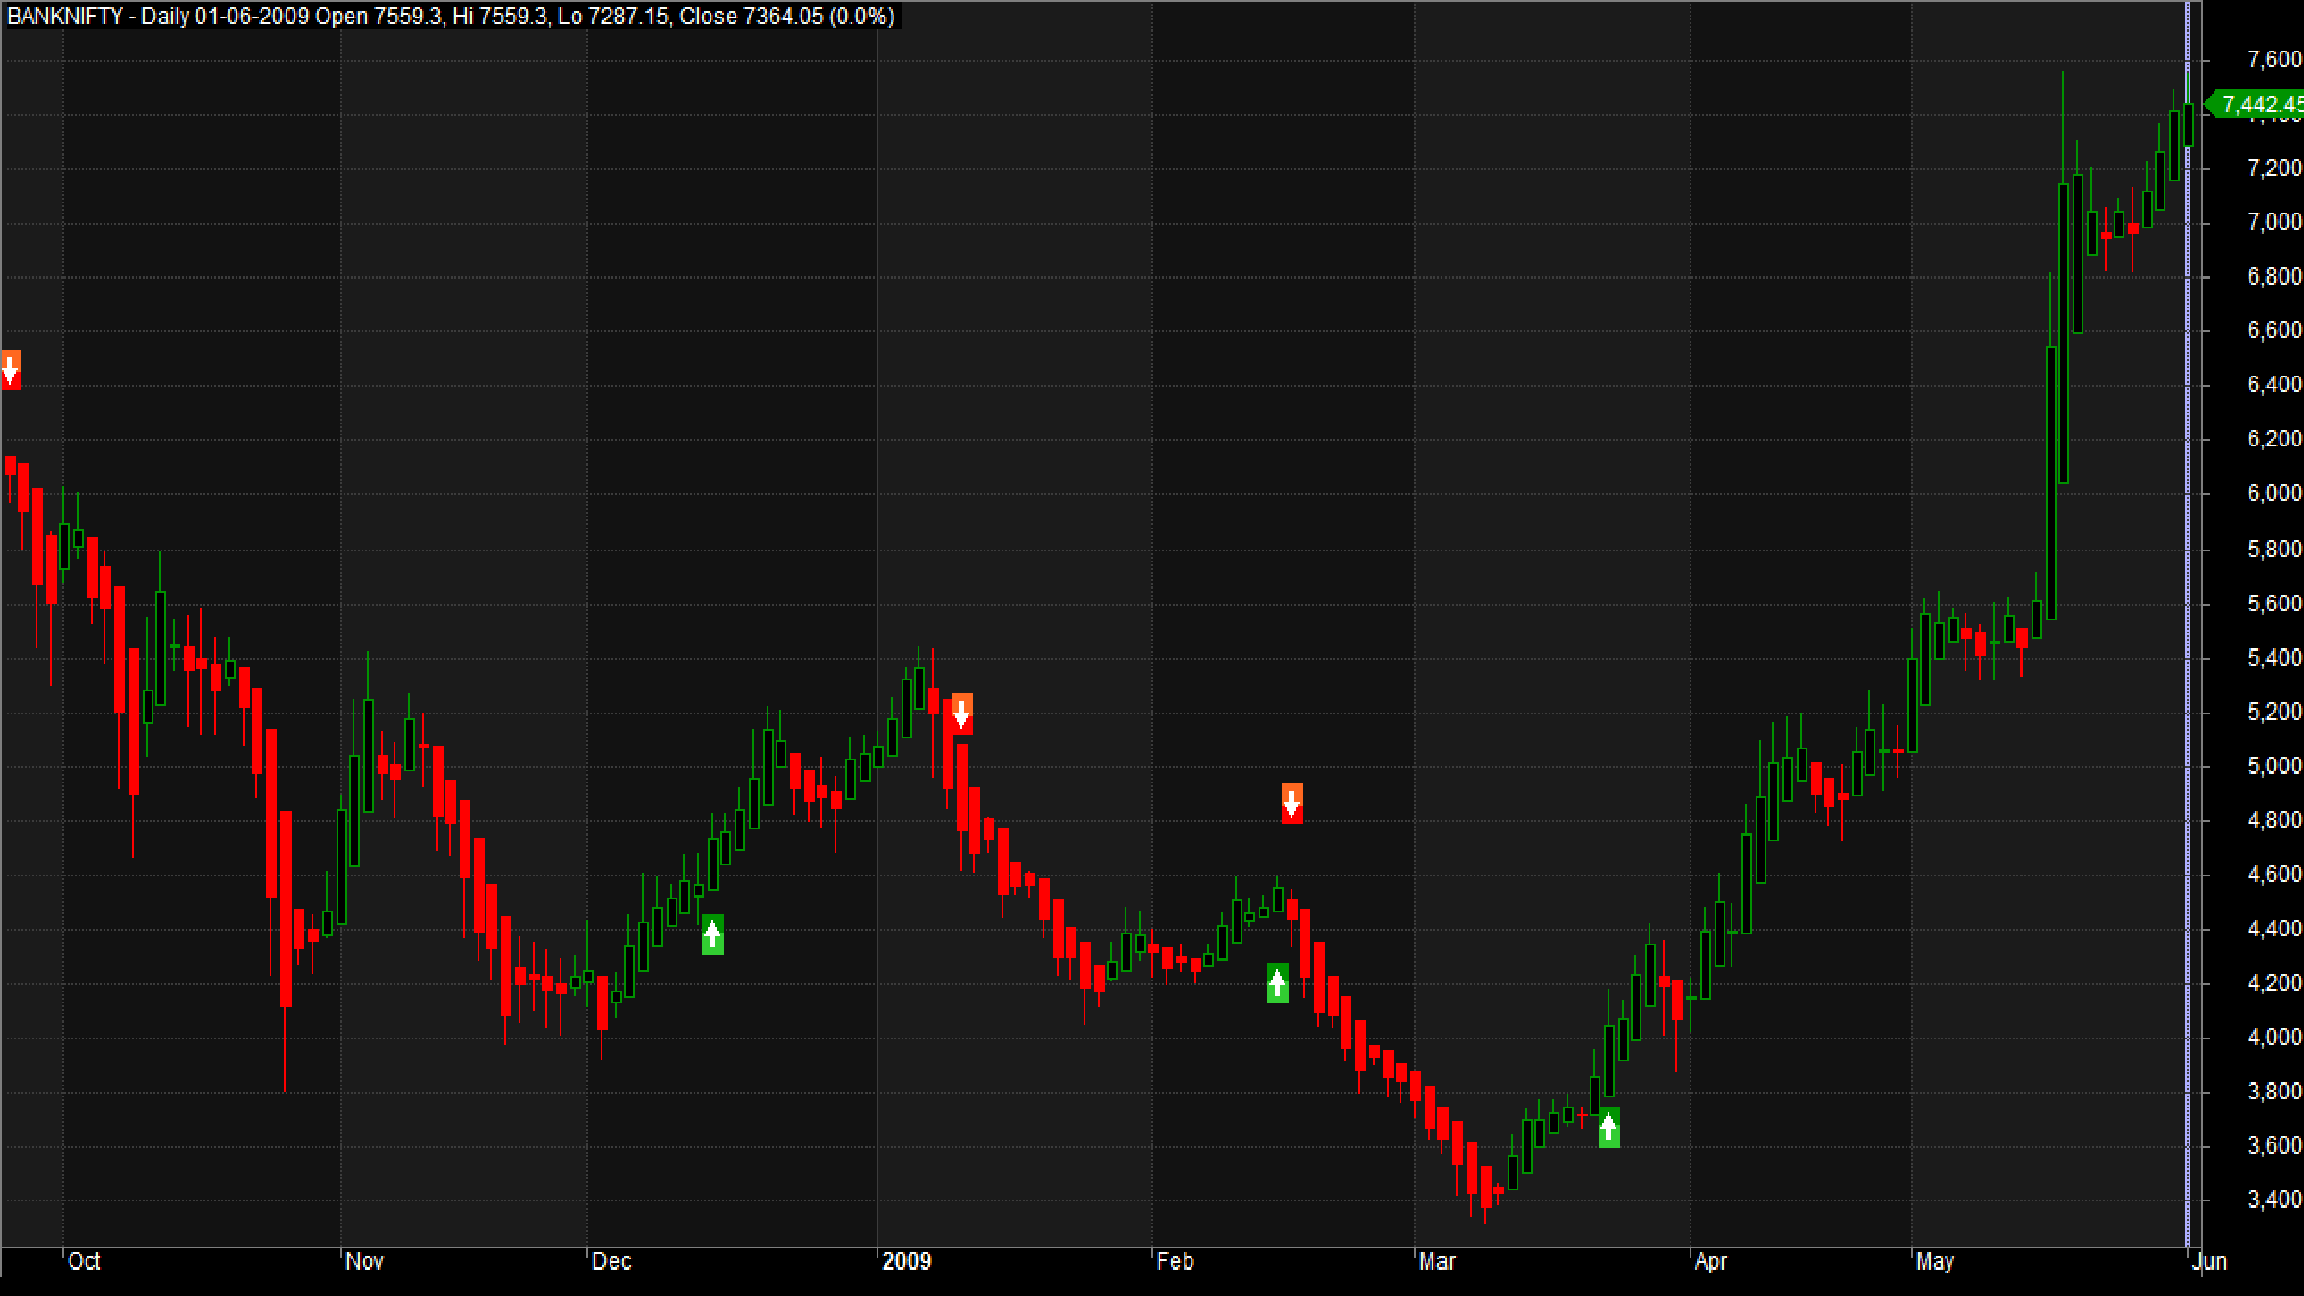
Examining price patterns using Heikin-Ashi charts is notably simpler and visually more compelling than it is with traditional candlestick charts. Refer to the following image for an illustration:

Determining Heikin-Ashi Prices
The OHLC values for Heikin-Ashi charts, which vary from conventional candlestick charts, are derived using the formula below:
- HAClose = (Open + High + Low + Close) / 4 – Signifying the average price of the current bar
- HAOpen = [HAOpen(Previous Bar) + HAClose(Previous Bar)] / 2 – Representing the midpoint of the preceding bar
- HAHigh = Max(High, HAOpen, HAClose) – Denoting the peak value in the set
- HALow = Min(Low, HAOpen, HAClose) – Indicating the minimal value in the set
Guidelines for Trading with Heikin-Ashi
The following encapsulates 5 critical rules (sourced from Investopedia) to adhere to when trading with the Heikin-Ashi method:
- Green candles devoid of lower “shadows” signal a robust uptrend: consider letting your profits run
- Green candles symbolize an uptrend: you might contemplate augmenting your long position, and abandoning short positions.
- A single candle with a diminutive body flanked by upper and lower shadows conveys a potential trend shift: traders comfortable with risk might opt to buy or sell at this point, while others may await further confirmation before adjusting their positions.
- Red candles flag a downtrend: consider enhancing your short position, and vacating long positions.
- Red candles absent of upper shadows indicate a potent downtrend: remain short until a trend alteration materializes.
Proceed to the subsequent section to explore an AFL and backtest report for this Heikin Ashi Trading System. Explore here to grasp AFL coding and construct your own Trading systems.
Heikin Ashi Trading System – Overview of AFL
| Parameter | Value |
| Preferred Time-frame | Daily |
| Indicators Used | EMA |
| Buy Condition | Formation of Heikin-Ashi green candle with Open=Low, and Close>40 period EMA of Close |
| Short Condition | Formation of Heikin-Ashi red candle with Open=High, and Close<40 period EMA of Close |
| Sell Condition |
|
| Cover Condition |
|
| Stop Loss | 1% |
| Targets | No fixed target |
| Position Size | 120 Quantities |
| Initial Equity | 200000 |
| Brokerage | 50 per order |
| Margin | 10% |
Heikin Ashi Trading System – AFL Code
Preview of AFL
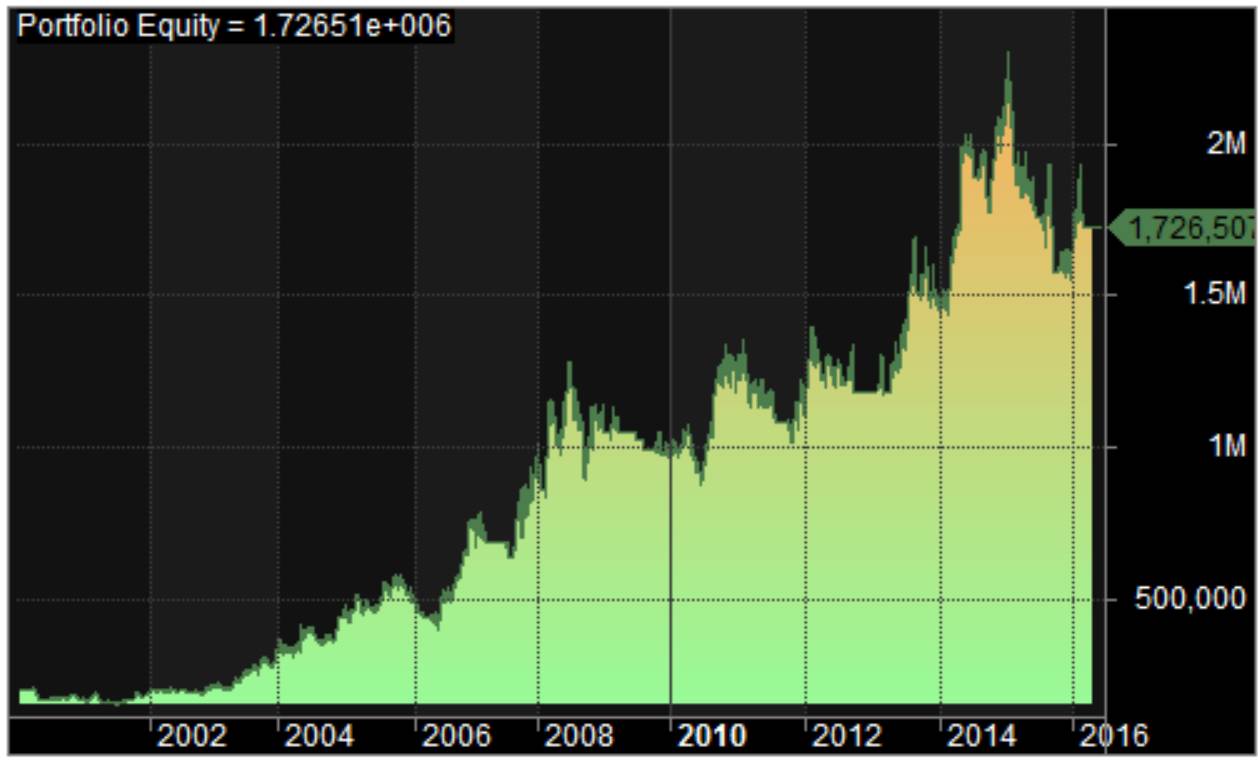
Heikin Ashi Trading System – Backtesting Report
| Paramter | Value |
| Fixed Position Size | |
| Initial Capital | 200000 |
| Final Capital | 1726506.44 |
| Scrip Name | NSE Banknifty |
| Backtest Period | 01-Mar-2000 to 09-Mar-2016 |
| Timeframe | Daily |
| Net Profit % | 763.25% |
| Annual Return % | 13.94% |
| Number of Trades | 276 |
| Winning Trade % | 25.36% |
| Average holding Period | 11.88 periods |
| Max consecutive losses | 18 |
| Max system % drawdown | -75.62% |
| Max Trade % drawdown | -32.42% |
It’s apparent that drawdowns are somewhat high. They could potentially be mitigated with apt Risk Management strategies. Download the exhaustive backtest report here.
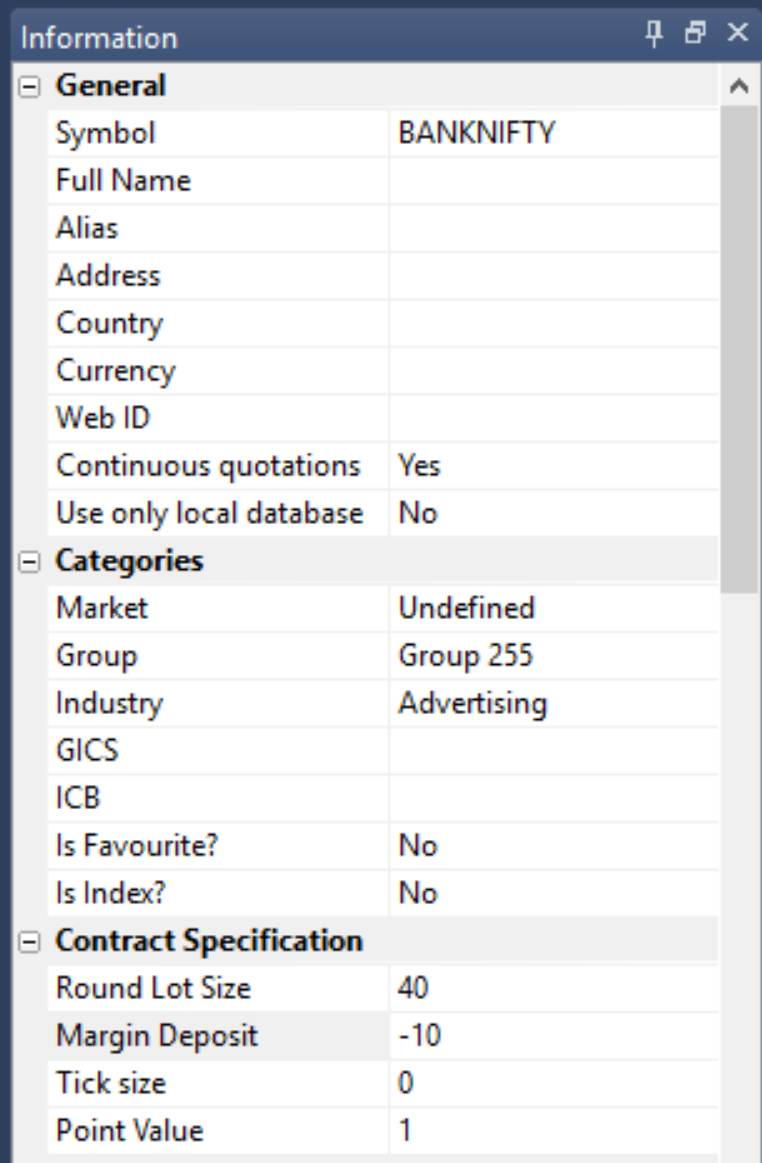
Additional Amibroker Settings for Backtesting
Navigate to Symbol→Information, and specify the lot size and margin requirement. The following screenshot demonstrates a lot size of 40 and a margin requirement of 10% for NSE Banknifty: