

Elliott Wave Theory is one of the most popular models for predicting stock market price movements. Developed by R.N. Elliott and popularized by Robert Prechter, it’s based on Dow theory, which states that stock prices move in cycles due to mass psychology, leading to repetitive patterns known as waves.
Explore our Excel-Based Trading Systems.
Deep Dive into Elliott Wave Theory
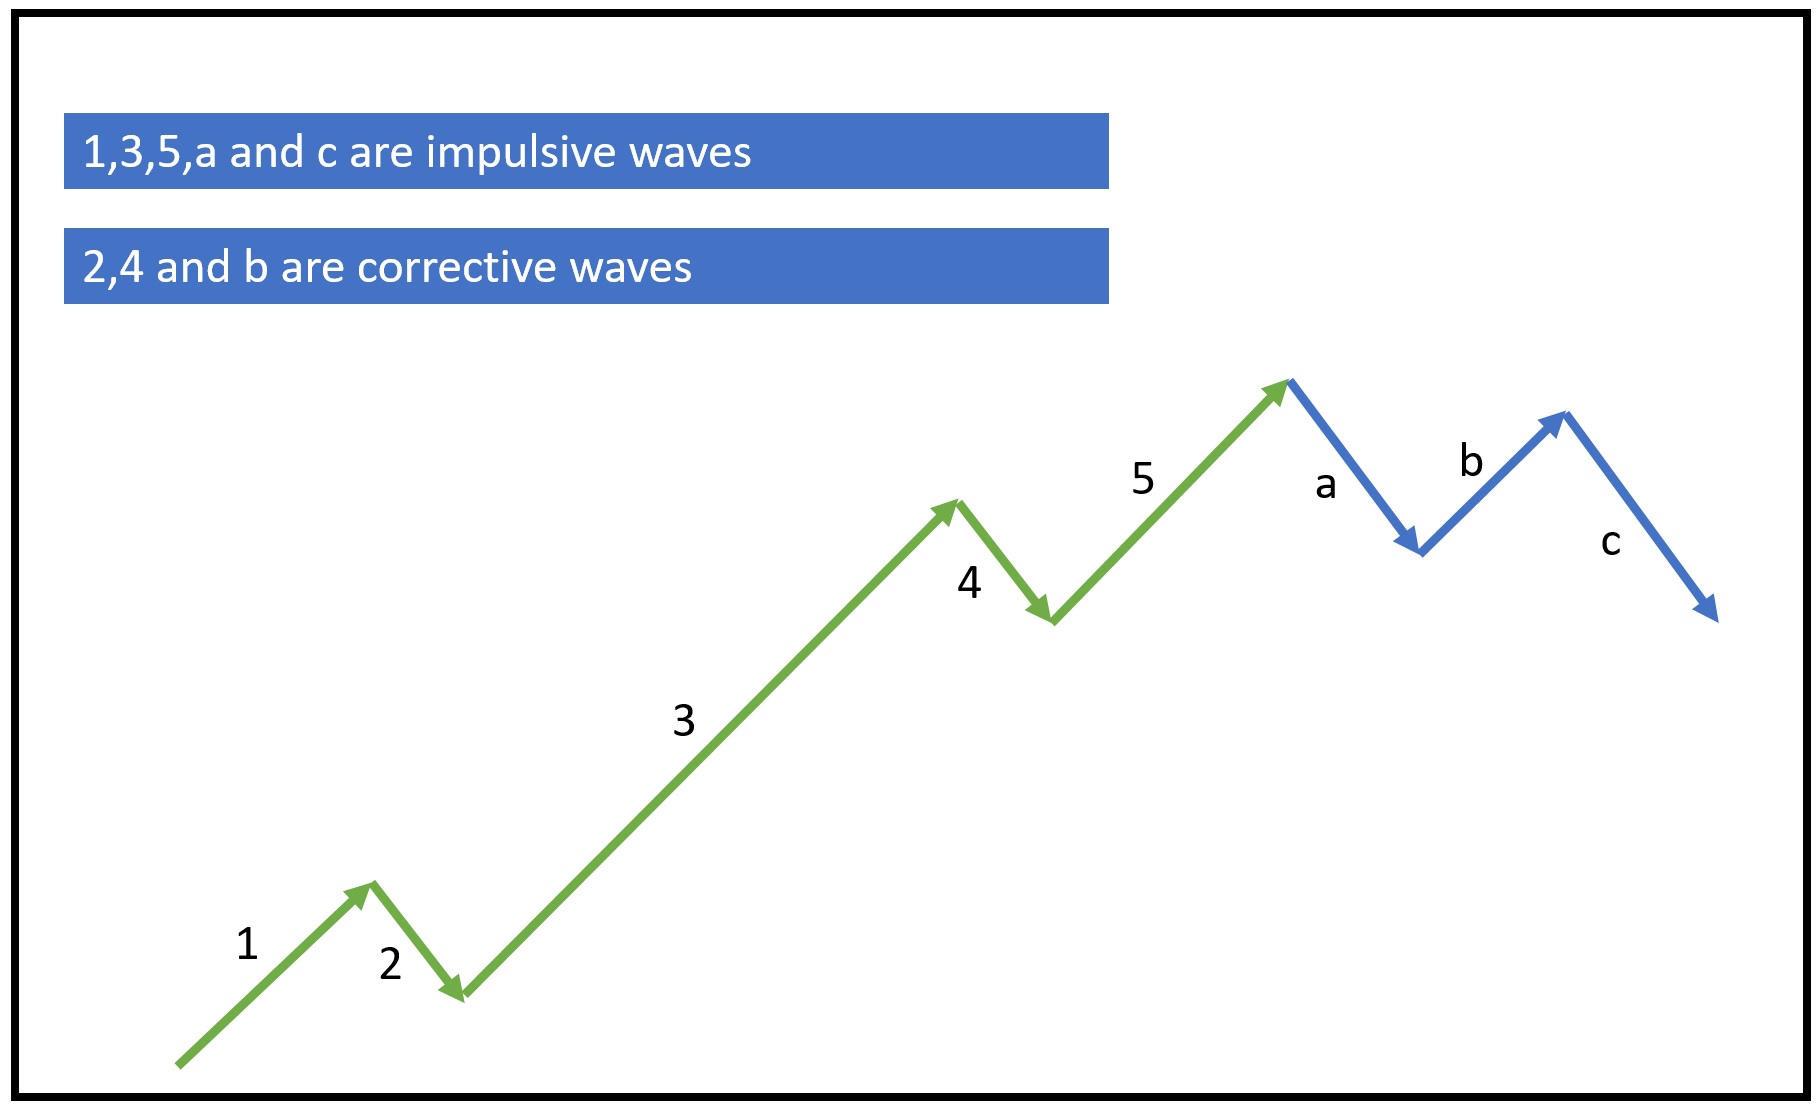
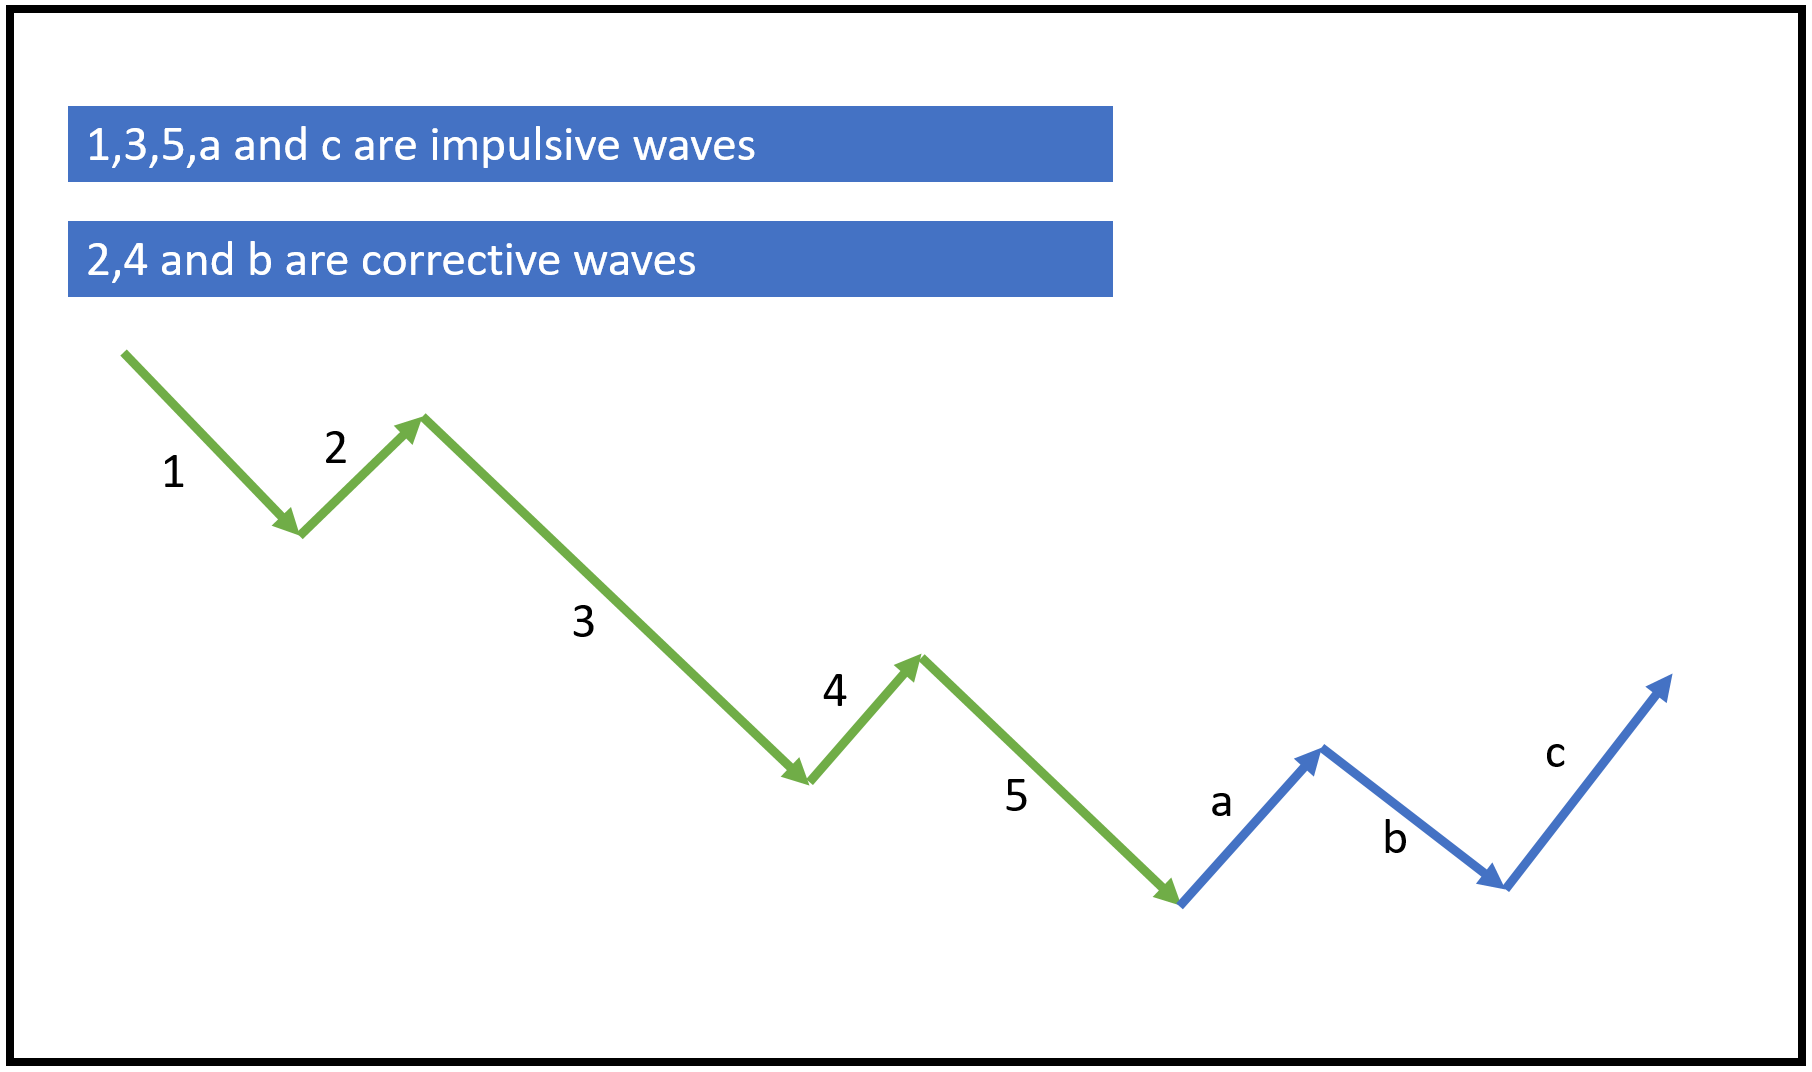
According to Elliott Wave Theory, a complete price cycle consists of eight waves, with five called Impulsive waves and three called Corrective waves.
During a bullish market trend, impulsive waves move upwards, while corrective waves move downwards.
Conversely, in a bearish market trend, impulsive waves move downwards, and corrective waves move upwards.
Elliott wave patterns can be observed across different timeframes, from intraday charts to monthly charts, with higher timeframes being less prone to false waves.
Three guiding principles for wave lengths in the Elliott Wave cycle:
Rule 1: Wave 2 cannot exceed 100% of Wave 1.
Rule 2: Wave 3 is never the shortest of the three impulse waves.
Rule 3: Wave 4 never overlaps with Wave 1.
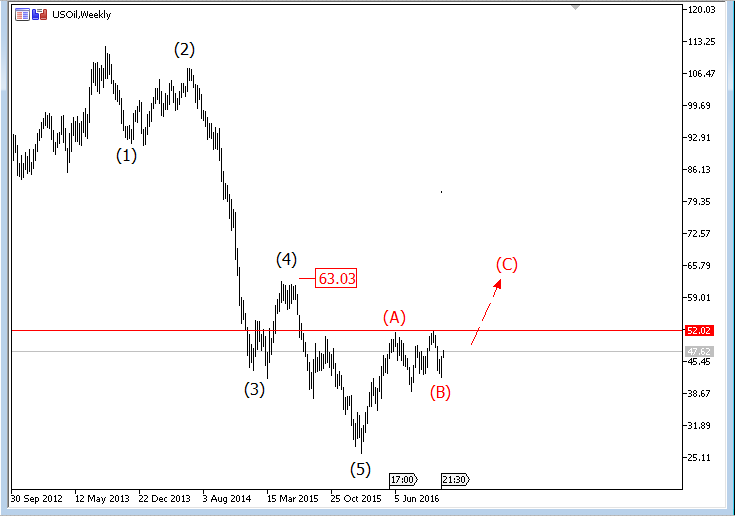
Practical Example: Elliott Wave Theory
Here’s an application of Elliott Wave Theory in a Crude Oil chart:
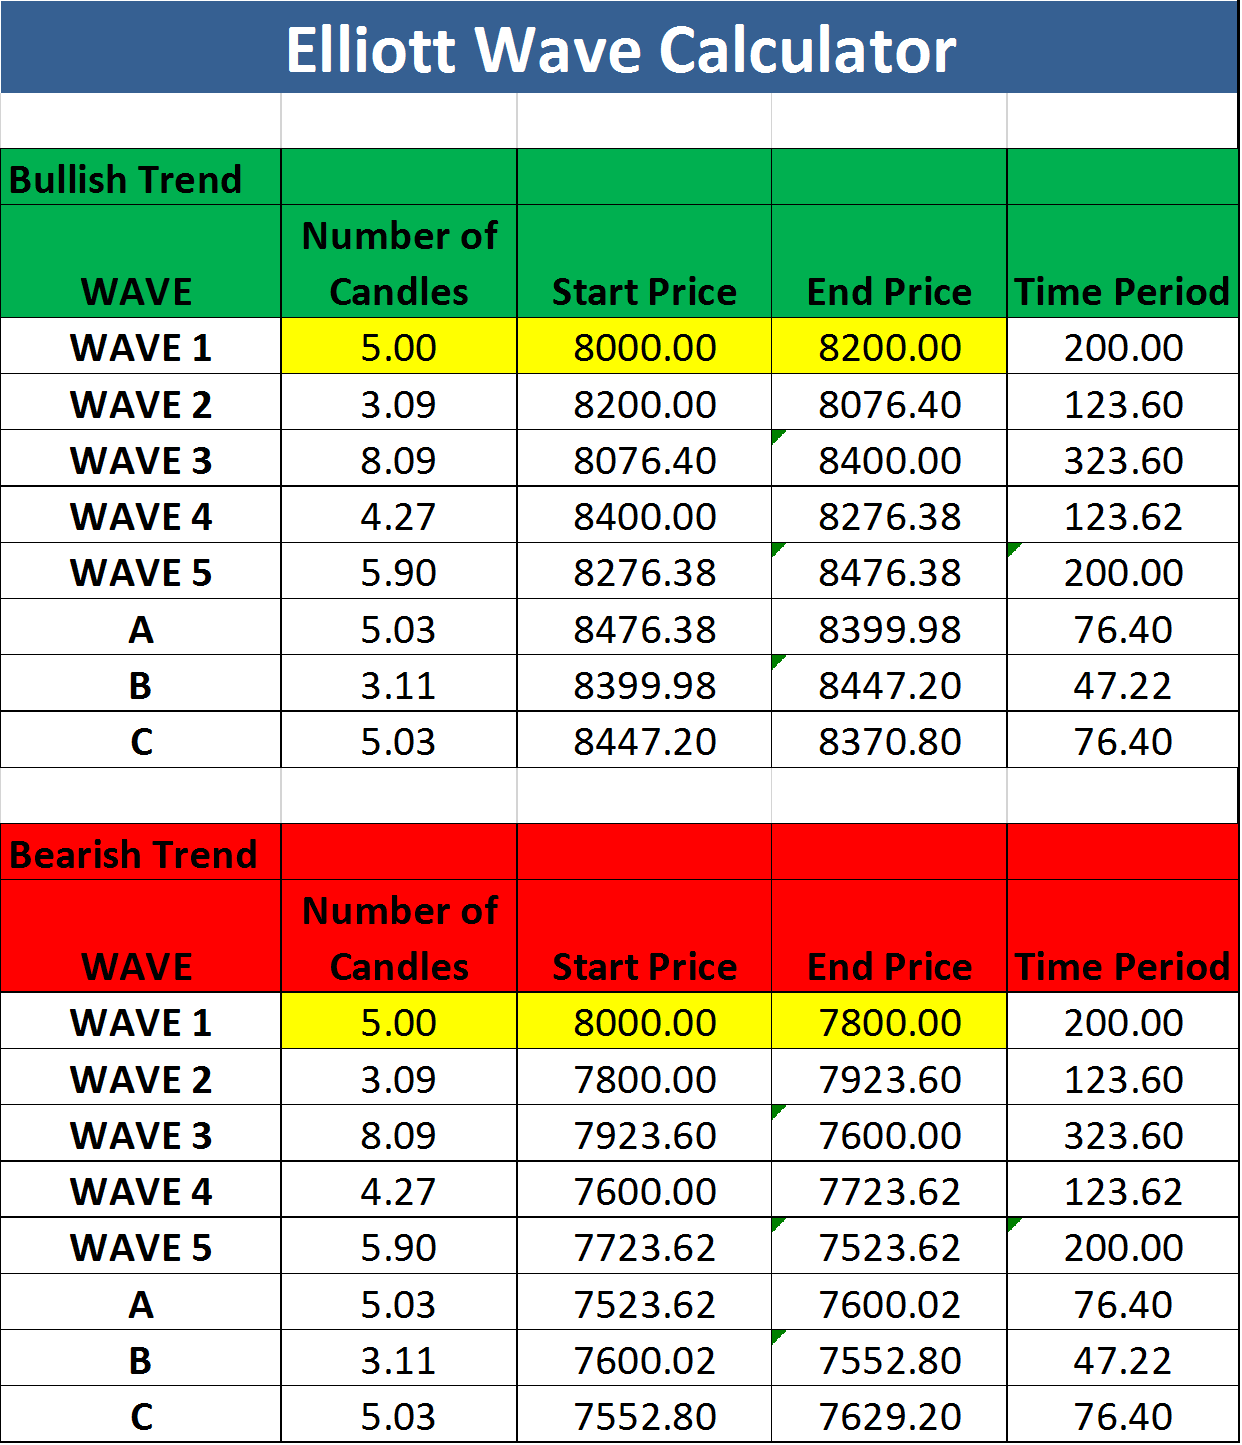
Elliott Wave Analysis Excel Sheet Overview
This Excel sheet calculates potential Elliott wave ranges and timeframes based on the input for Wave 1. Here’s an overview:
| Parameter | Description | |
| Worksheet Name | Elliott Wave Calculator | |
| Inputs | Number of candles (B5, B16) | Number of candles or bars that Wave 1 lasted. |
| Start Price (C5, C16) | Starting price for Wave 1 | |
| End Price (D5, D16) | End price for Wave 1 | |
| Outputs | Time Period (column E) | Time period for each wave |
| Wave 2, 3, 4, 5, a, b, c range and time period | Probable range and time period for other waves based on the input for Wave 1 | |
Screenshot
How to Use This Excel Sheet?
Here are the simple steps to utilize the Option Greeks Calculator Excel sheet, with minimal manual intervention:
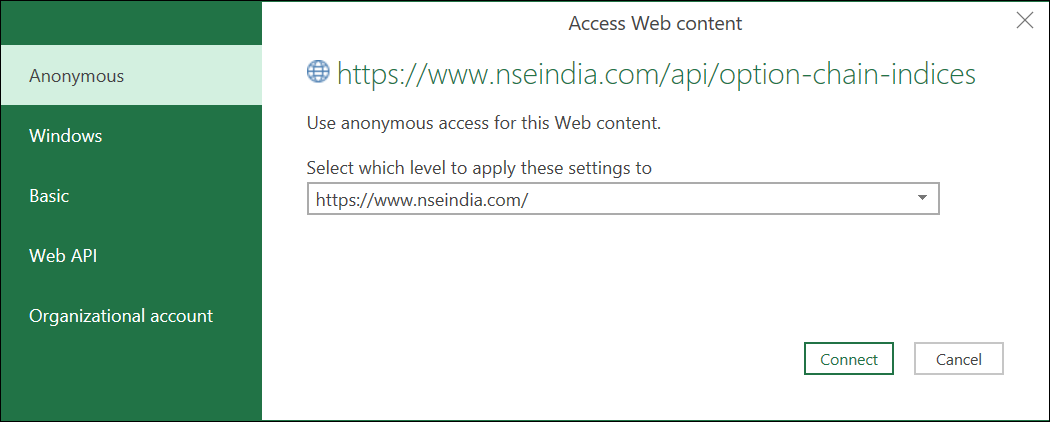
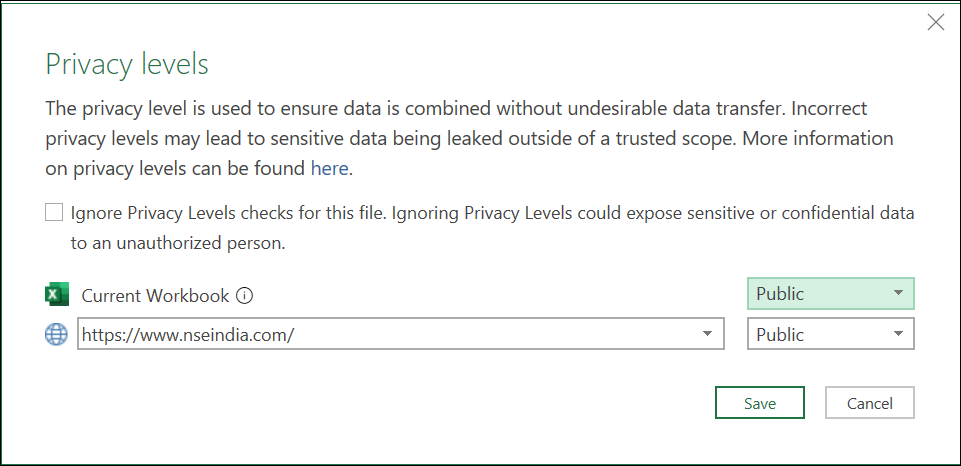
Step 1: Open the Excel file and ensure you have an internet connection. Enable Macros and Data connections if prompted.
Step 2: You may encounter privacy settings prompts for the NSE India website when opening the sheet for the first time. Set it to “public” as shown in the screenshots below:
Step 3: Fill in the required fields: Symbol, Symbol Type, Expiry Date, Risk-free Interest Rate, and Dividend Yield.
Step 4: The Greek values will be automatically updated. The sheet refreshes every five minutes.
Step 5: If the data doesn’t refresh correctly or times out, follow the instructions in the next section to set the cookie value.
Setting Up Cookie Value (Optional)
If the Excel sheet doesn’t fetch data automatically due to web scraping restrictions on the new NSE website, follow these steps:
Head to the Cookie worksheet and paste the cookie value from your browser into cell A2.

Refer to the instructions below to retrieve the cookie value in Google Chrome and Mozilla Firefox browsers:
Google Chrome
Step 1: Open this URL in your browser.
Step 2: Press CTRL + SHIFT + I to open the Inspect window OR right-click anywhere on the web page and select “Inspect.”
Step 3: Navigate to the Network menu within the Inspect window and press CTRL + R to reload the page.
Step 4: Once the page reloads, click on Option Chain.
Step 5: Choose “option-chain-indices?symbol=NIFTY” from the list. In the headers, copy the value of bm_sv located in Response Headers –> set-cookie.
Step 6: Paste the copied value in cell A2 of the cookie worksheet.
Mozilla Firefox
Step 1: Open this URL in your browser.
Step 2: Right-click anywhere on the web page and select “Inspect Element.”
Step 3: Access the Network menu within the Inspect window.
Step 4: Click on Option Chain from the webpage.
Step 5: Choose “option-chain-indices?symbol=NIFTY” from the list. In the Cookies section, copy the value of bm_sv.
Step 6: Paste the copied value in cell A2 of the cookie worksheet.
Data Refresh Frequency
The sheet’s data refreshes automatically when:
- You open the sheet
- Click on Data –> Refresh All
- Every 5 minutes (as specified in the connection properties)
You can adjust the refresh frequency to your preference in the connection properties.
Download Link
Enter your email address below to receive the sheet in your mailbox. Alternatively, you can use this link.
If you have any questions, please let us know in the comments section.
Common Errors and Troubleshooting
Error Message
The message “Query ‘option-chain-nse-new’ (step ‘AutoRemovedColumns1’) is accessing data sources that have privacy levels that cannot be used together. Please rebuild this data combination.”
Troubleshooting Steps:
- Set the privacy levels to “public” when you first access the sheet, as described in “How to use this Excel Sheet –> Step 2” above. If you missed it, modify the privacy settings from Data –> Get Data –> Data Source Settings.
- If the above step doesn’t work, go to Data –> Get Data –> Query Options. Select ‘Privacy’ on the left and click “Ignore the privacy levels and potentially improve performance.”
Error Message
The error message “[DataSource.Error] The request was aborted: Could not create SSL/TLS secure channel Microsoft excel 2016.”
Troubleshooting Steps:
- If you are using Excel 2016, ensure your OS is Windows 10 or above. Otherwise, this error may occur.
- This error is often due to TLS version mismatch. Check this link for a possible solution that may require modifying the Windows registry.
- Some users have resolved the error by reinstalling MS Office.
Download Link for Elliott Wave Analysis Excel Sheet
Please download the Excel sheet from the below link. Let us know in the comments section if you have any queries.
Elliott Wave Analysis Spreadsheet


One Comment