Discover the DOJI Candlestick Pattern Identifier: A Free Amibroker AFL Tool
Understanding the DOJI Candlestick Pattern
Recognized widely among traders, the Doji candlestick pattern is a key indicator for spotting potential trend reversals. This unique pattern emerges when an asset’s opening and closing prices are nearly identical, leading to a candlestick with a tiny or absent body.
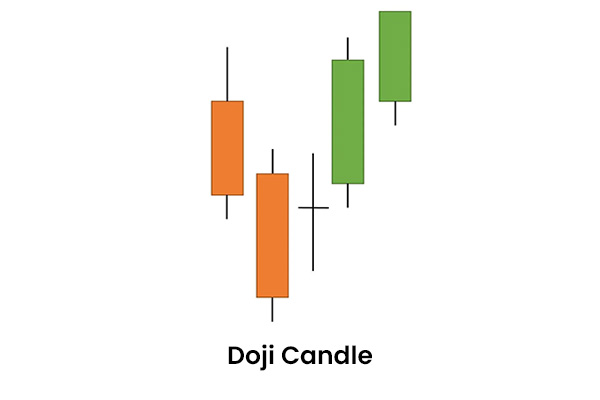
The pattern represents a moment of market uncertainty, signaling a balance between buyers and sellers. It’s often seen as a precursor to a trend shift, particularly following a pronounced uptrend or downtrend. Traders typically wait for additional technical cues or price movement analysis before acting on this pattern.
Further Reading: Decoding Candlestick Patterns in Stock Analysis
Download the DOJI Candlestick Pattern Identifier for Amibroker
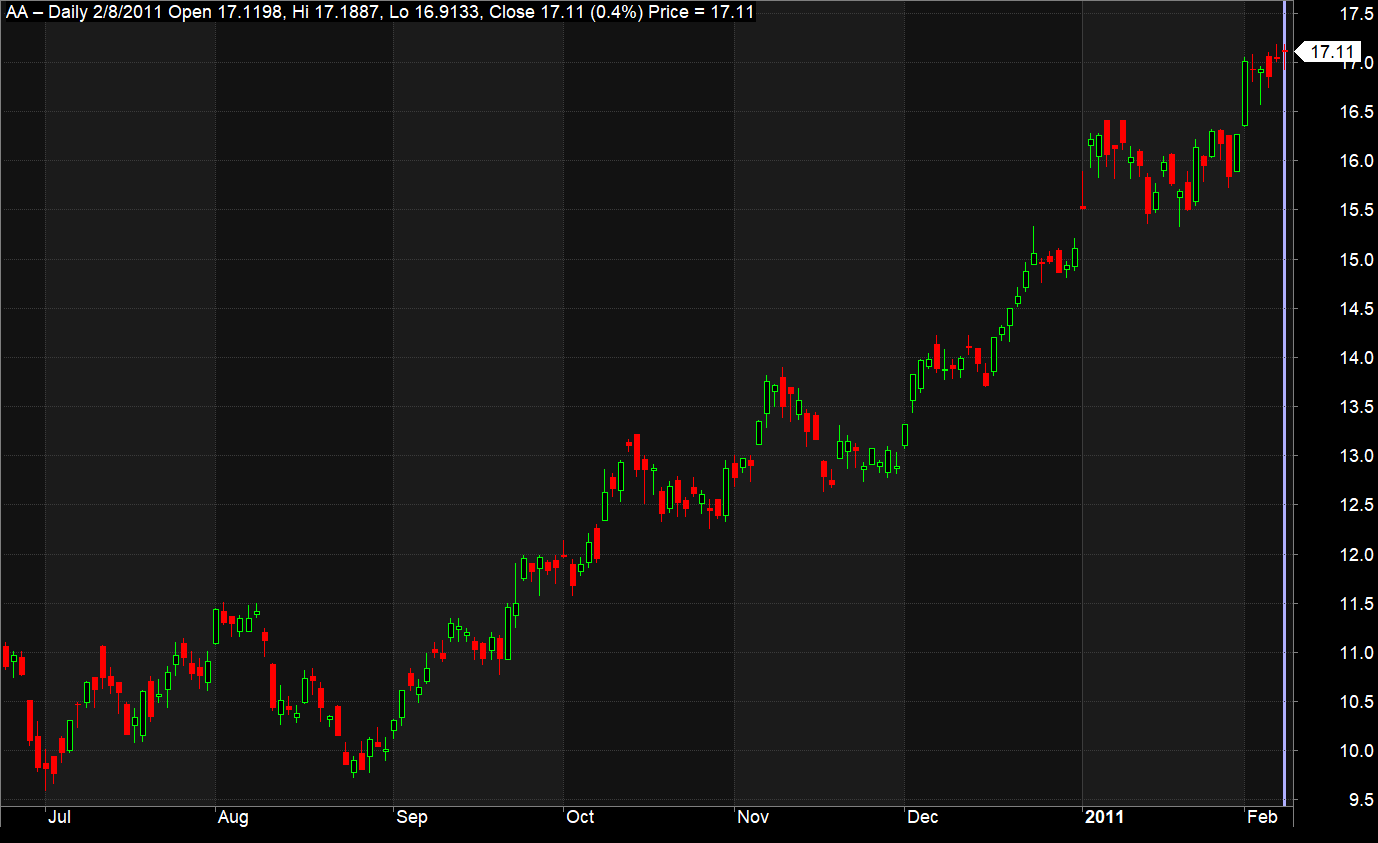
Preview of the DOJI Candlestick Pattern Identifier AFL in Amibroker
Take a peek at the AFL’s interface below:
How the AFL Works
- We start by setting up some variables to calculate the Doji candlestick pattern. This includes measuring the upper and lower shadows, plus the candlestick’s body. The upper shadow measures the difference between the high point and the highest of the opening or closing prices. The lower shadow gauges the difference between the lowest of the opening or closing prices and the candlestick’s low point. And the body? It’s simply the absolute difference between opening and closing prices.
- Next, we define what makes a Doji candlestick. This involves using the average true range (ATR) of the past 14 periods, multiplied by 0.3. The result is a threshold, set at 30% of the current ATR. A candlestick with a body smaller than this threshold? That’s our Doji.
- To finalize the Doji pattern identification, we check a few things. Both upper and lower shadows should be less than 10% of the body size. Plus, the body size itself must be under our earlier threshold. When these conditions align, we’ve got a Doji candlestick pattern. We then mark it with a small green circle at the candlestick’s high, offset by -10 to avoid overlap.
Remember, this is just one way to spot a Doji candlestick pattern. There are many other methods out there. This code serves as a starting point and is not the only solution for identifying this pattern.