

The Parabolic SAR, also known as PSAR, is a straightforward yet potent technical indicator. While most of the technical indicators we’ve discussed help determine the beginning or direction of a trend, the Parabolic SAR aids in recognizing when the ongoing trend concludes and the next one begins. “SAR” stands for “Stop and Reverse.” This indicator was crafted by the renowned technical analyst, “Welles Wilder,” who is also responsible for other widely-used indicators like RSI, ADX, and ATR. It relies on momentum with respect to time and offers highly accurate predictions of price reversals. In this article, we’ll delve into a Parabolic SAR Trading system for NSE Nifty. This profitable strategy can also be applied to other stocks and instruments.
Click here to explore AFL coding and create your own trading systems.
How to Utilize Parabolic SAR in Trading?
Using Parabolic SAR is incredibly straightforward. When plotted on a stock chart, it displays a series of dots either above or below the price line.
- If the PSAR dotted line is positioned below the price, it signifies a buy signal.
- If the PSAR dotted line is above the price, it indicates a sell signal.
This method works effectively in trending markets but may result in false signals in sideways markets. Many traders also use Parabolic SAR as a stop-loss indicator to exit their trades.
Overview of the Parabolic SAR Trading System – AFL
| Parameter | Value |
| Preferred Time-frame | Daily |
| Indicators Used | SAR (Stop and Reverse) |
| Buy Condition | Price candle crosses SAR dotted line from the bottom. |
| Short Condition | Price candle crosses SAR dotted line from the top. |
| Sell Condition |
|
| Cover Condition |
|
| Stop Loss | 1% |
| Targets | 5% |
| Position Size | 100% of Equity |
| Initial Equity | 200000 |
| Brokerage | 100 per order |
| Margin | 10% |
Parabolic SAR Trading System – AFL Code
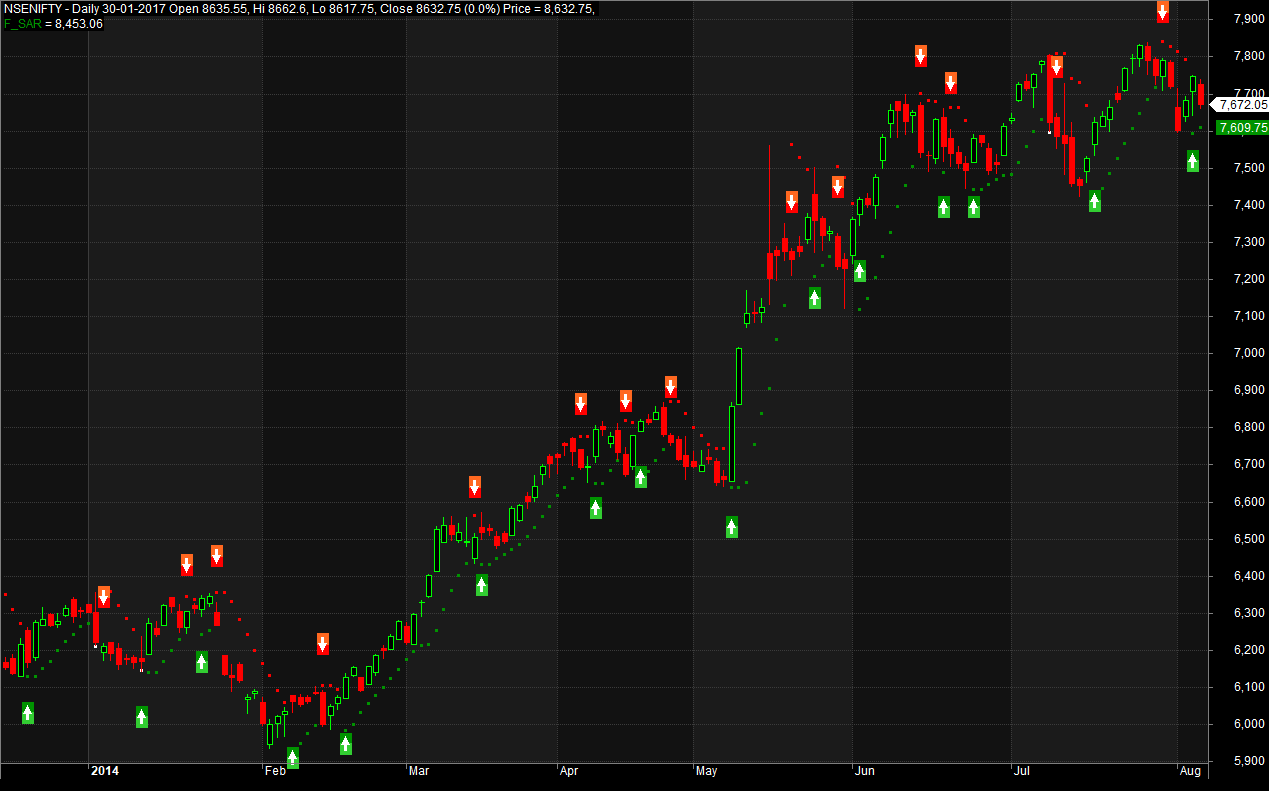
AFL Screenshot
As you can observe in the chart, the frequency of signals is quite high. It can be further improved by adjusting the parameters or using it in conjunction with other indicators.
Backtest Report for the Parabolic SAR Trading System
The Nifty SAR trading system maintains consistent performance with minimal drawdown. A Monte Carlo simulation also reveals impressive results, with a probability of less than 10% of failure.
| Parameter | Value |
| Nifty | |
| Initial Capital | 200000 |
| Final Capital | 1311059.26 |
| Scrip Name | NSE Nifty |
| Backtest Period | 01-Jan-2004 to 25-Sep-2017 |
| Timeframe | Daily |
| Net Profit % | 555.53% |
| Annual Return % | 15.45% |
| Number of Trades | 556 |
| Winning Trade % | 34.35% |
| Average Holding Period | 4.33 periods |
| Max Consecutive Losses | 14 |
| Max System % Drawdown | -22.18% |
| Max Trade % Drawdown | -5.98% |
Download the comprehensive backtest report here.
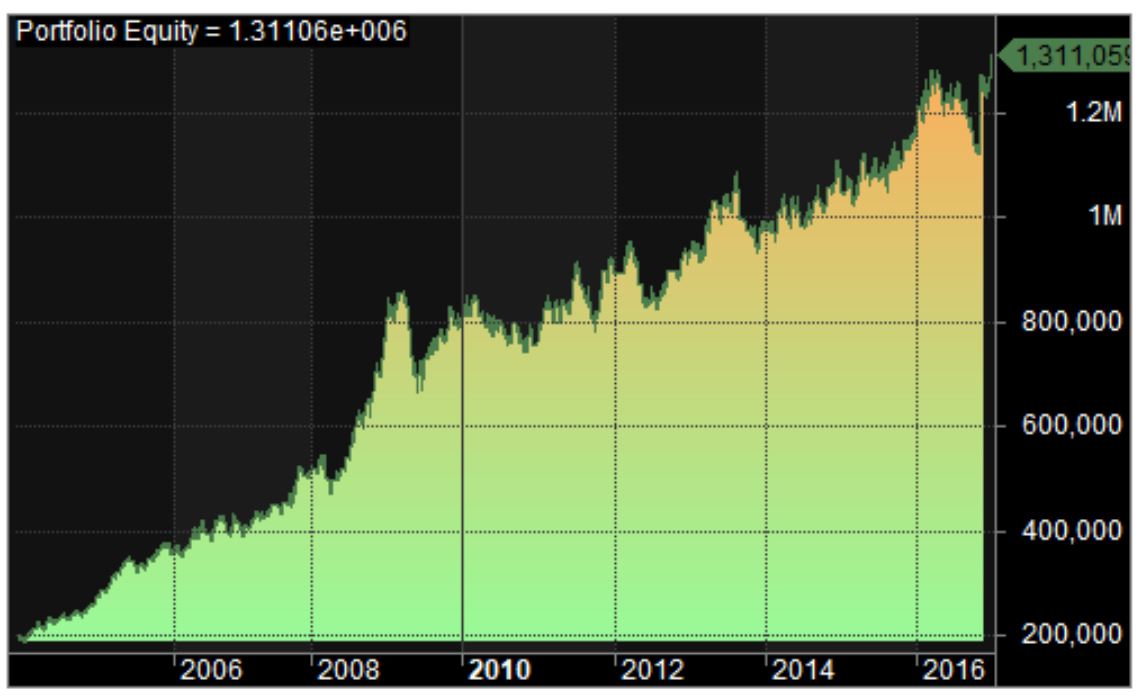
Equity Curve
The equity curve remains steady and almost linear.
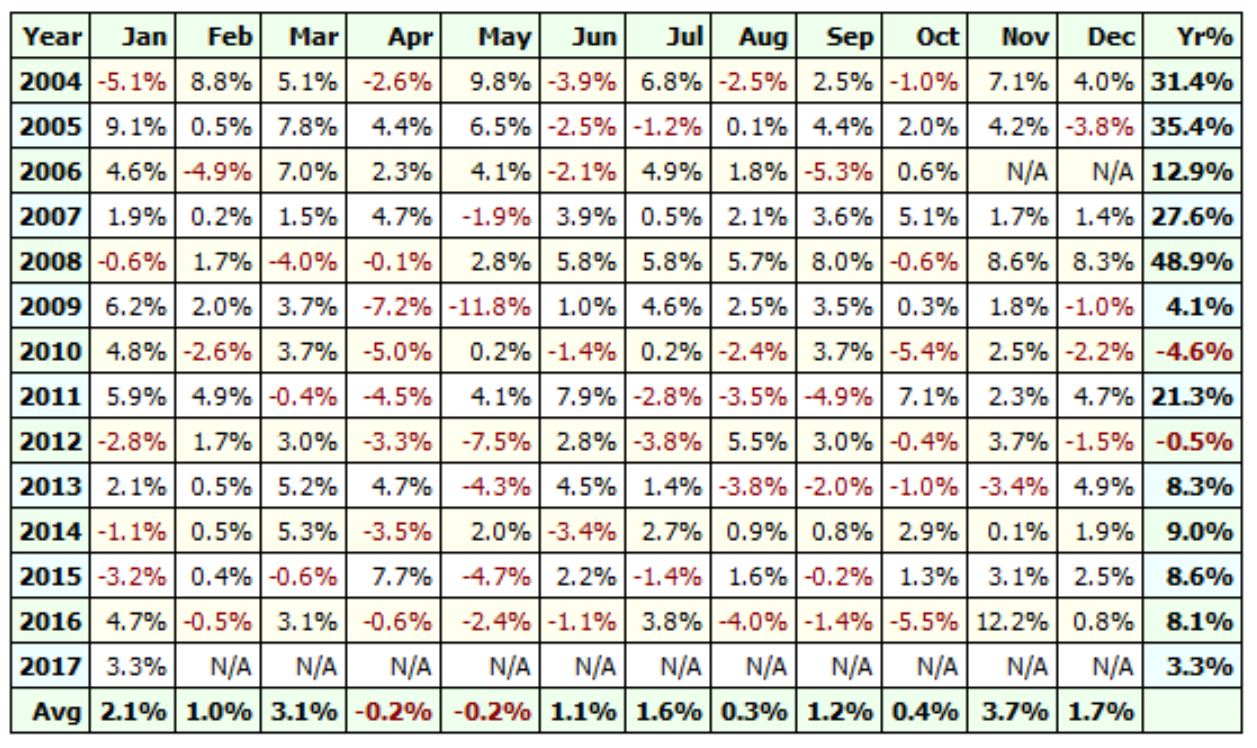
Profit Table
Additional Amibroker Settings for Backtesting
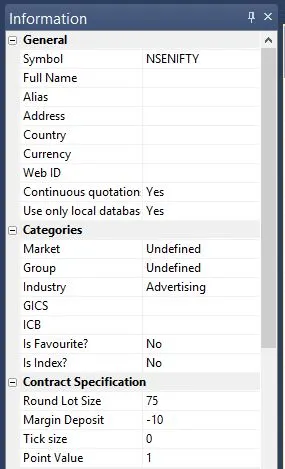
Go to Symbol –> Information, and specify the lot size and margin requirement. The screenshot below shows a lot size of 75 and a margin requirement of 10% for NSE Nifty:


One Comment