Options stand out as a dynamic tool in the financial markets, offering more versatility than typical stock or commodity trading. In the latter, you predict price movements to make a profit: buying when the outlook is positive and selling when it’s negative. Accurately forecasting the direction of the price movement, however, is a tough challenge. Options, on the other hand, offer a unique edge. They allow traders to speculate on the price direction, time frame, and market volatility. Additionally, the high degree of leverage that comes with options can amplify gains. To tap into this potential, we’ve developed an automated options strategy payoff calculator in Excel. You need only to input your trade details, and the calculator will provide you with a detailed breakdown of your trade’s maximum profit, risk exposure, and other vital statistics. Read further to learn how to utilize this powerful tool.
Why Trade Multiple Options Simultaneously?
Simultaneously trading multiple options allows for the creation of a tailored strategy. Options strategies give traders the flexibility to express their market views and craft a trade that fits their risk and reward preferences. With adequate knowledge and the right tools, like those provided by Trading Tuitions, the possibilities are limitless.
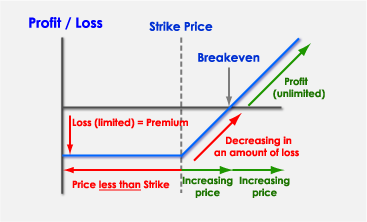
Take a long call option, for instance. Its risk-reward profile is straightforward: while the profit potential is unlimited, the risk is confined to the premium paid. Yet, when it comes to more intricate strategies with multiple legs, such as the Butterfly spread, determining the profit-loss potential is not as straightforward. This is where profit and loss diagrams, known as “payoff diagrams,” come into play.
Also Read: Demystifying Market Profile Basics: Trading Insights
What is a Payoff Diagram?
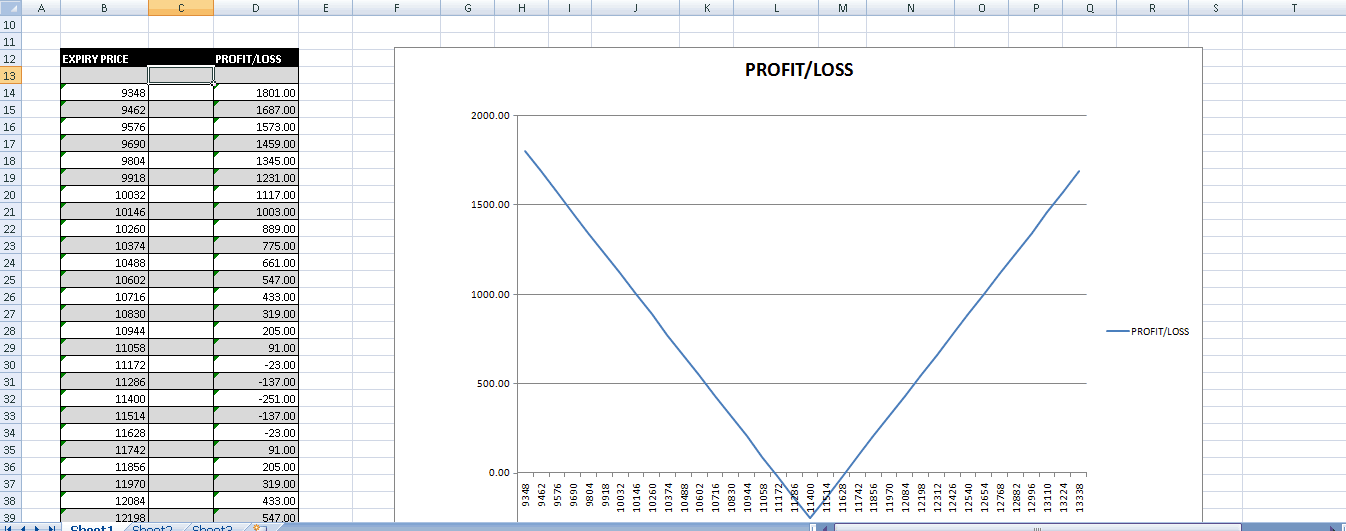
A payoff diagram graphically shows the expected performance of an options strategy across various expiration prices. This representation helps traders quickly grasp the potential outcomes of their strategies. The profits or losses are plotted on the vertical axis, while the underlying asset’s expiration prices are laid out on the horizontal axis.
PAYOFF DIAGRAM OF A LONG CALL

A payoff diagram makes it easy to understand the potential results at various expiration prices. For a long call option, it illustrates that if the expiration price is below the strike price, the trader’s loss is limited to the premium paid. However, if the underlying asset’s price is above the strike price, the profit increases with the price of the underlying asset after breakeven.
Also Read: A Beginner’s Guide to Diagonal Spreads
Using the Options Strategy Payoff Calculator: A Step-by-Step Guide
Step 1:
Download the Options Strategy Payoff Calculator Excel sheet from the link provided below, and open it to get started.
Step 2:
Select the type of option and input the necessary details such as quantity, strike price, premium, and the current market price. Remember, input a negative quantity if you’re shorting options.
Step 3:
Apply the same process to all parts of your strategy. If any legs are not in use, set their quantities to zero. For example, for a strategy involving two legs, fill in the details for those two and ensure all other legs are set to zero.

Step 4:
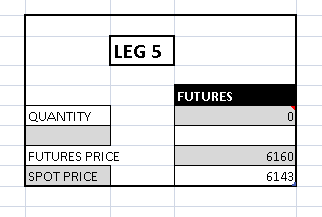
Should your strategy involve buying or selling stock or futures, like in a covered call or protective put, enter its details in the fifth leg of the calculator. If this doesn’t apply to your strategy, keep the quantity at zero.

You will automatically get payoff table and diagram along with the net premium flow and maximum profit and loss potential for your strategy.


Step 5:
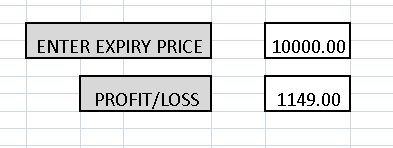
To calculate potential profits or losses for a specific expiration price, enter this price into the calculator. It will display the profit or loss for the strategy if the underlying asset expires at that price.

Download the Excel Sheet
To access the Options Strategy Payoff Calculator Excel sheet, click the link below. Once opened, input your trade details as outlined in the steps above to see your strategy’s potential payoff diagram.


One Comment