
Master the Markets with the DEMA and RSI Trading System

Delving into intraday trading without a robust strategy can lead to disappointment. Most methods that excel over longer terms fail in the intraday space due to numerous false signals. Reducing these misleading indicators is key to developing a successful intraday trading system. We’re excited to reveal a system that excels in trend-following and utilizes DEMA (Double Exponential Moving Average) and RSI. The approach of the DEMA and RSI trading system confirms signals by consulting the RSI from a daily timeframe, offering a reliable strategy for intraday traders. Explore the details of the system, its performance, and the AFL code below. Discover other powerful intraday systems we’ve analyzed here.

System Summary: The DEMA and RSI Intraday Strategy

Parameter Details
Preferred Timeframe 5 minutes
Key Indicators DEMA, RSI
Buy Signal Criteria
  • DEMA of 2 periods goes above the 10 periods DEMA
  • Daily RSI is below 30
  • Trades executed between 9:30 AM to 3:15 PM
Short Signal Criteria
  • DEMA of 2 periods dips below the 10 periods DEMA
  • Daily RSI is above 50
  • Trades executed between 9:30 AM to 3:15 PM
Exit Strategy for Short Match Buy criteria or when the time is at or beyond 3:15 PM
Exit Strategy for Long Match Short criteria or when the time is at or beyond 3:15 PM
Stop Loss Recommendation 0.5%
Profit Targets Undefined, trade based on the system’s signals
Consistent Position Size 150 units
Starting Capital 200,000
Estimated Brokerage Cost 100 per trade
Margin Requirement 10%

System Code

Access the AFL code for the DEMA RSI Intraday System through the link below. Import it into Amibroker and you’re ready to go.
				
					//------------------------------------------------------
//
//  Formula Name:    Intraday Trading System: DEMA and RSI
//  Website:         https://zerobrokerageclub.com/
//------------------------------------------------------

_SECTION_BEGIN("Intraday Trading System: DEMA and RSI"); 

SetTradeDelays( 1, 1, 1, 1 );
SetOption( "InitialEquity", 200000);
SetOption("FuturesMode" ,True);
SetOption("MinShares",1);
SetOption("CommissionMode",2);
SetOption("CommissionAmount",100);
SetOption("AccountMargin",10);
SetPositionSize(150,spsShares);
//SetPositionSize(100,spsPercentOfEquity);
SetOption( "AllowPositionShrinking", True );
BuyPrice=Open;
SellPrice=Open;
ShortPrice=Open;
CoverPrice=Open;

SetChartOptions(0,chartShowArrows|chartShowDates);
_N(Title = StrFormat("{{NAME}} – {{INTERVAL}} {{DATE}} 
Open %g, Hi %g, Lo %g, Close %g (%.1f%%) {{VALUES}}", O, H, L, C, SelectedValue( ROC( C, 1 ) ) ));

TimeFrameSet( inDaily ); // switch to daily time frame
rsid1 = rsi(14);
TimeFrameRestore(); 

rsid = TimeFrameexpand( rsid1, inDaily ); 

NewDay = (Day()!= Ref(Day(), -1)) OR BarIndex() == 0;  
Plot(NewDay,"",colorlightGrey,styleHistogram|styleDots|styleNoLabel|styleOwnScale);

FirstTradeTime=093000;
SquareOffTime = 151500;

r1=Param("r1",2,2,10,1);
r2=Param("r2",10,10,50,5);
rsilow= Param("rsilow",30,10,40,10);
rsihigh= Param("rsihigh",50,50,90,10);

Plot(DEMA(C, r1),"FastDEMA",colorWhite);
Plot(DEMA(C, r2),"SlowDEMA",colorBlue);
Plot(rsid,"DailyRSI",colorYellow,styleOwnScale);


Buy=Cross(DEMA(C, r1) ,DEMA(C, r2)) AND rsid<rsilow AND TimeNum()>= FirstTradeTime AND TimeNum()<SquareOffTime;;
Short=Cross(DEMA(C, r2), DEMA(C, r1)) AND rsid>rsihigh AND TimeNum()>= FirstTradeTime AND TimeNum()<SquareOffTime;;
Sell=short OR TimeNum() >= SquareOffTime;
Cover=buy OR TimeNum() >= SquareOffTime;

Buy=ExRem(Buy,Sell);
Sell=ExRem(Sell,Buy);

Short=ExRem(Short,Cover);
Cover=ExRem(Cover,Short);

StopLoss=Param("stop",0.5,0.5,2,0.5);
ApplyStop(Type=0,Mode=1,Amount=StopLoss);


printf("\nBuy : " + Buy );  
printf("\nSell : " + Sell );  
printf("\nShort : " + Short );  
printf("\nCover : " + Cover ); 


/* Plot Buy and Sell Signal Arrows */
PlotShapes(IIf(Buy, shapeSquare, shapeNone),colorGreen, 0, L, Offset=-40);
PlotShapes(IIf(Buy, shapeSquare, shapeNone),colorLime, 0,L, Offset=-50);
PlotShapes(IIf(Buy, shapeUpArrow, shapeNone),colorWhite, 0,L, Offset=-45);
PlotShapes(IIf(Cover, shapeSquare, shapeNone),colorGreen, 0, L, Offset=-40);
PlotShapes(IIf(Cover, shapeSquare, shapeNone),colorLime, 0,L, Offset=-50);
PlotShapes(IIf(Cover, shapeUpArrow, shapeNone),colorWhite, 0,L, Offset=-45);
PlotShapes(IIf(Sell, shapeSquare, shapeNone),colorRed, 0, H, Offset=40);
PlotShapes(IIf(Sell, shapeSquare, shapeNone),colorOrange, 0,H, Offset=50);
PlotShapes(IIf(Sell, shapeDownArrow, shapeNone),colorWhite, 0,H, Offset=-45);
PlotShapes(IIf(Short, shapeSquare, shapeNone),colorRed, 0, H, Offset=40);
PlotShapes(IIf(Short, shapeSquare, shapeNone),colorOrange, 0,H, Offset=50);
PlotShapes(IIf(Short, shapeDownArrow, shapeNone),colorWhite, 0,H, Offset=-45);
 

_SECTION_END();


System Performance

Take a look at how the AFL chart appears in Amibroker:

DEMA-RSI-Intraday-System

Learn More: Grow Your Savings: Understand Mutual Fund Types

Backtesting Results

This intraday system has proven to be highly accurate and adaptable across various market conditions. Its annual CAGR of 21.49% places it above many other systems, and it maintains a low drawdown, ensuring reliability. Here are the detailed results:

Performance MetricNifty
Initial Investment200,000
Ending Balance1,188,711.75
Market FocusNSE Nifty
Testing PeriodJan 2010 – Feb 2019
Timeframe5 Minutes
Total Profit (%)494.36%
Yearly Returns (%)21.49%
Total Trades1438
Win Rate (%)49.86%
Avg. Duration of TradesApprox. 57.57 intervals
Maximum Consecutive Losses7
Biggest System Drawdown (%)-17.33%
Largest Drop in a Single Trade (%)-21.88%

For a detailed backtest report, download it here.

Equity Curve

The equity curve is smooth and steady, showcasing the system’s consistent performance without any large, unexpected dips.

RSI-DEMA-Intraday-Equity-Curve

Profit Consistency

Since its inception in 2010, this system has demonstrated a solid track record of stable, year-on-year profits.

RSI-DEMA-Intraday-Profit-Table

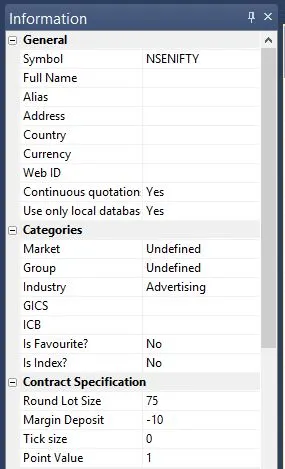
Backtesting with Amibroker

Adjust Amibroker settings to suit your trade specifics. Here’s an example of setting the lot size and margin requirement for NSE Nifty:


Symbol-Info_Nifty