
Mastering the art of debugging is essential for every coder. It’s the key to efficiently finding and fixing errors in your code. Tools for debugging are a staple in most Integrated Development Environments (IDEs), and Amibroker AFL editor is no exception. This guide is focused on the “Debug Amibroker AFL Code” process, providing step-by-step instructions.
For a detailed exploration of Amibroker software, including its features and a range of learning resources, check out this comprehensive guide.
Easy Steps to Debug Amibroker AFL Code
Amibroker’s version 6.1.0 introduced a handy visual debugger. If your version is older, some options discussed here may not be available:
Step 1: Start by opening your AFL code in the formula editor.
Step 2: Set a breakpoint by moving your cursor to a line of code and pressing F9. You can also click the red circle in the toolbar or select “Debug –> Insert/Remove Breakpoint“.
What’s a Breakpoint? A breakpoint is a specific part of the code where the execution stops. This allows you to check variables or calculations in detail. For instance, you can pause right after calculating a simple moving average (SMA) to verify its assignment to a variable.
Set as many breakpoints as needed for thorough debugging.
Step 3: Initiate debugging by clicking “Debug –> Go” or pressing F5. The execution will pause at the first breakpoint, marked by a yellow arrow. Here’s what it looks like:
Step 4: At each breakpoint, you can examine variable values simply by hovering your mouse over them. You can also open the “Watch Window” to see all variable values at once. Activate it by selecting “Windows –> Watch“. This window also offers additional features like the ‘Arrays’ tab and ‘Expression editor’.
Step 5: Advance to the next breakpoint using “Debug –> Step Over” or F10. To inspect a user-defined function more closely, opt for “Debug –> Step Into” or press F11.
Step 6: Keep repeating the above steps until you’ve debugged the entire program.
Also, don’t miss: Best PC Configuration to run Amibroker
Debugging with the TRACE Function in Amibroker
For those using Amibroker versions before 6.1.0, the TRACE function is a go-to tool for debugging.
This method differs as you can’t use breakpoints. Instead, wrap the specific line you want to check with _TRACE(). Check out how it’s done below:
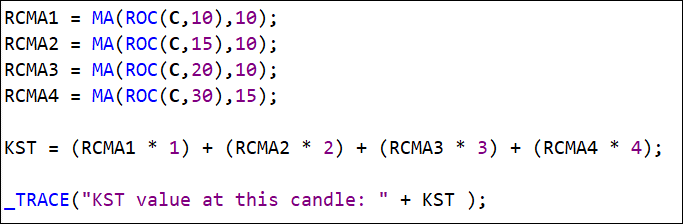
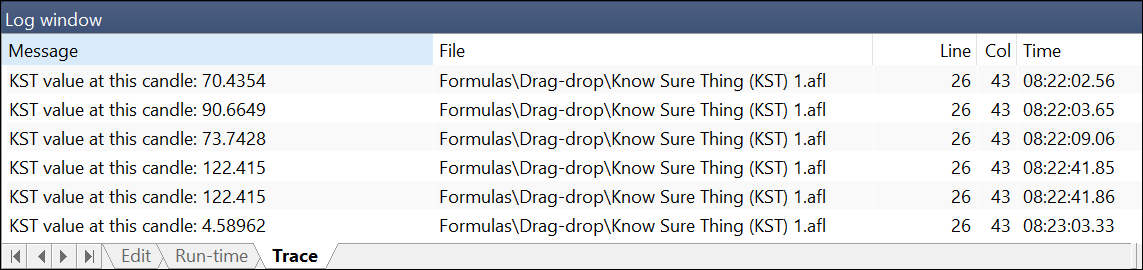
View the results of the _TRACE() function in the log window. Simply click on Window –> Log to see it in action.
 Additionally, you can send the output to an external logger, like DebugView.
Another useful function is _TRACEF(), which works similarly to _TRACE() but allows printf style formatting in its first argument.
While the Trace function may not be as user-friendly as a visual debugger, it’s still a valuable tool for custom debugging, especially in terms of formatting outputs.
Alternative Debugging Techniques for Amibroker AFL
There are several other practical methods for debugging your AFL code. Choose the one that fits your debugging style:
- To observe the value of any variable at each candle, use the exploration feature with the AddColumn() function.
- Debug the backtesting process by selecting the “Detailed Log” in the backtester settings. This helps in visualizing each step and trade taken at every candle.
- Implement the printf() function in your formula to monitor variable values in the interpretation window.