On popular demand, we’ve developed an Amibroker AFL for the Intraday Open High Low strategy. This strategy involves taking positions when the Open equals the High or Low for a given security in an Intraday timeframe. We’ve also provided an Excel sheet and Live signals for this system. Please refer to the following links:
In the next section, we’ll provide an AFL and backtest report for this Trading System. Click here to learn AFL coding and create your own Trading systems.
AFL Overview
| Parameter | Value |
| Preferred Timeframe | Intraday 5 minute |
| Indicators Used | None |
| Buy Condition | Open=Low in Intraday Timeframe post 30 minutes of market open |
| Short Condition | Open=High in Intraday Timeframe post 30 minutes of market open |
| Sell Condition |
|
| Cover Condition |
|
| Stop Loss | 0.5% |
| Targets | 2.5% |
| Position Size | 50% of Equity |
| Initial Equity | 200000 |
| Brokerage | 100 per order |
| Margin | 10% |
AFL Code
Download the AFL code from the link below:
					//------------------------------------------------------
//
//  Formula Name:    Intraday Open High Low Trading System
//  Website:        https://zerobrokerageclub.com/
//------------------------------------------------------

_SECTION_BEGIN("Intraday Open High Low Trading System");

SetTradeDelays( 1, 1, 1, 1 );
SetOption( "InitialEquity", 200000);
SetOption("FuturesMode" ,True);
SetOption("MinShares",1);
SetOption("CommissionMode",2);
SetOption("CommissionAmount",100);
SetOption("AccountMargin",10);
SetOption("RefreshWhenCompleted",True);
SetPositionSize(50,spsPercentOfEquity);
SetOption( "AllowPositionShrinking", True );
SetOption("MaxOpenPositions",10);
BuyPrice=Open;
SellPrice=Open;
ShortPrice=Open;
CoverPrice=Open;

SetChartOptions(0,chartShowArrows|chartShowDates);
_N(Title = StrFormat("{{NAME}} – {{INTERVAL}} {{DATE}} Open %g, Hi %g, Lo %g, Close %g (%.1f%%) {{VALUES}}", O, H, L, C, SelectedValue( ROC( C, 1 ) ) ));
Plot( Close, "Price", colorWhite, styleCandle );

NewDay = (Day()!= Ref(Day(), -1)) OR BarIndex() == 0;

Plot(NewDay,"",colorlightGrey,styleHistogram|styleDots|styleNoLabel|styleOwnScale);

FirstTradeTime=094500;
SquareOffTime = 151500;

DayOpen=TimeFrameGetPrice("O",inDaily);
DayHigh = HighestSince(NewDay,H,1);
DayLow = LowestSince(NewDay,L,1);

printf("\nDayOpen : " + DayOpen );
printf("\nDayHigh : " + DayHigh );
printf("\nDayLow : " + DayLow );

Buy = (round(DayOpen)==round(DayLow)) AND High>=(sqrt(DayOpen)+0.0833)^2 AND (TimeNum()  >= FirstTradeTime) AND TimeNum()<SquareOffTime;
Short = (round(DayOpen)==round(DayHigh)) AND Low<=(sqrt(DayOpen)-0.0833)^2 AND (TimeNum()  >= FirstTradeTime) AND TimeNum()<SquareOffTime;

Sell = TimeNum() >= SquareOffTime;
Cover = TimeNum() >= SquareOffTime;

Buy=ExRem(Buy,Sell);
Sell=ExRem(Sell,Buy);

Short=ExRem(Short,Cover);
Cover=ExRem(Cover,Short);

printf("\nBuy : " + Buy );
printf("\nSell : " + Sell );
printf("\nShort : " + Short );
printf("\nCover : " + Cover );

StopLoss=0.5;
ApplyStop(Type=0,Mode=1,Amount=StopLoss);

Target=2.5;
ApplyStop(Type=1,Mode=1,Amount=Target);

/* Plot Buy and Sell Signal Arrows */
PlotShapes(IIf(Buy, shapeSquare, shapeNone),colorGreen, 0, L, Offset=-40);
PlotShapes(IIf(Buy, shapeSquare, shapeNone),colorLime, 0,L, Offset=-50);
PlotShapes(IIf(Buy, shapeUpArrow, shapeNone),colorWhite, 0,L, Offset=-45);
PlotShapes(IIf(Cover, shapeSquare, shapeNone),colorGreen, 0, L, Offset=-40);
PlotShapes(IIf(Cover, shapeSquare, shapeNone),colorLime, 0,L, Offset=-50);
PlotShapes(IIf(Cover, shapeUpArrow, shapeNone),colorWhite, 0,L, Offset=-45);
PlotShapes(IIf(Sell, shapeSquare, shapeNone),colorRed, 0, H, Offset=40);
PlotShapes(IIf(Sell, shapeSquare, shapeNone),colorOrange, 0,H, Offset=50);
PlotShapes(IIf(Sell, shapeDownArrow, shapeNone),colorWhite, 0,H, Offset=-45);
PlotShapes(IIf(Short, shapeSquare, shapeNone),colorRed, 0, H, Offset=40);
PlotShapes(IIf(Short, shapeSquare, shapeNone),colorOrange, 0,H, Offset=50);
PlotShapes(IIf(Short, shapeDownArrow, shapeNone),colorWhite, 0,H, Offset=-45);

_SECTION_END();
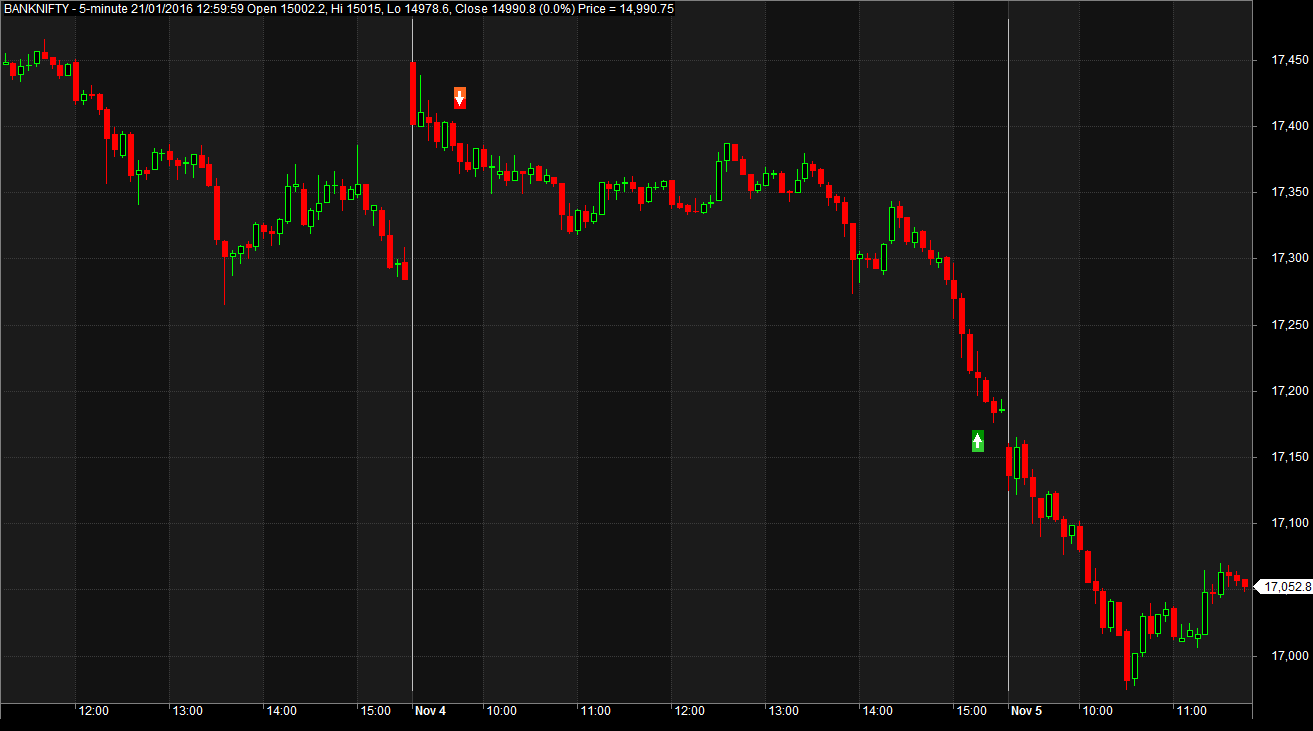
AFL Screenshot
Backtest Report
Here are the details of the backtest:
| Parameter | Value |
| Fixed Position Size | |
| Initial Capital | 200000 |
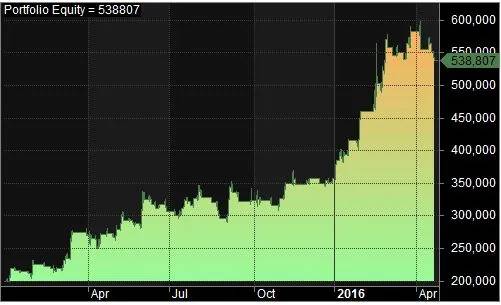
| Final Capital | 538807.42 |
| Scrip Name | NSE Nifty, NSE BankNifty |
| Backtest Period | 02-Jan-2015 to 26-Apr-2016 |
| Timeframe | 5 Minutes |
| Net Profit % | 169.40% |
| Annual Return % | 111.15% |
| Number of Trades | 130 |
| Winning Trade % | 48.46% |
| Average holding Period | 48.95 periods |
| Max consecutive losses | 8 |
| Max system % drawdown | -16.20% |
| Max Trade % drawdown | -11.64% |
Download the detailed backtest report here.
Equity Curve
Additional Amibroker settings for backtesting
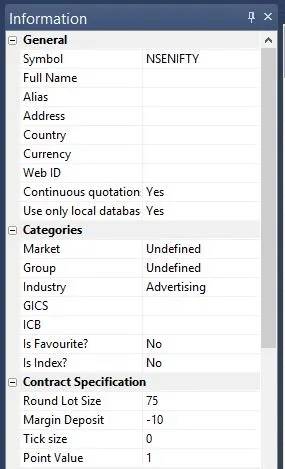
For additional settings, you can go to Symbol–>Information and specify the lot size and margin requirement. Here’s an example for NSE Nifty:
