
Chaikin Money Flow is a go-to indicator for many active traders, especially those keen on technical analysis. It serves as a cornerstone for several lucrative algorithmic trading setups. In this article, we will unveil a fully-automated Excel sheet that computes the Chaikin Money Flow for any stock symbol. This sheet comes with real-time buy and sell signals, plus intraday timeframe backtesting results. Dive deeper into this post to learn more about this indicator, and grab the Excel sheet from the post’s end.
Curious about other Excel-based trading systems? Hit the link below:
Unveiling Chaikin Money Flow
The Chaikin Money Flow (CMF) acts as an oscillator with values swinging between -1 and +1. It provides insights into the buying or selling momentum of a security over a chosen lookback period. While you can choose any lookback duration, 20 or 21 periods are commonly selected. Esteemed technical analyst Marc Chaikin created this indicator. It shines in measuring a specified period’s money flow volume, thanks to the blend of money flow and volume in a single indicator, garnering favor among technical analysts.
Decoding CMF Calculation and Interpretation
Let’s break down the steps to calculate Chaikin Money Flow for any financial asset:
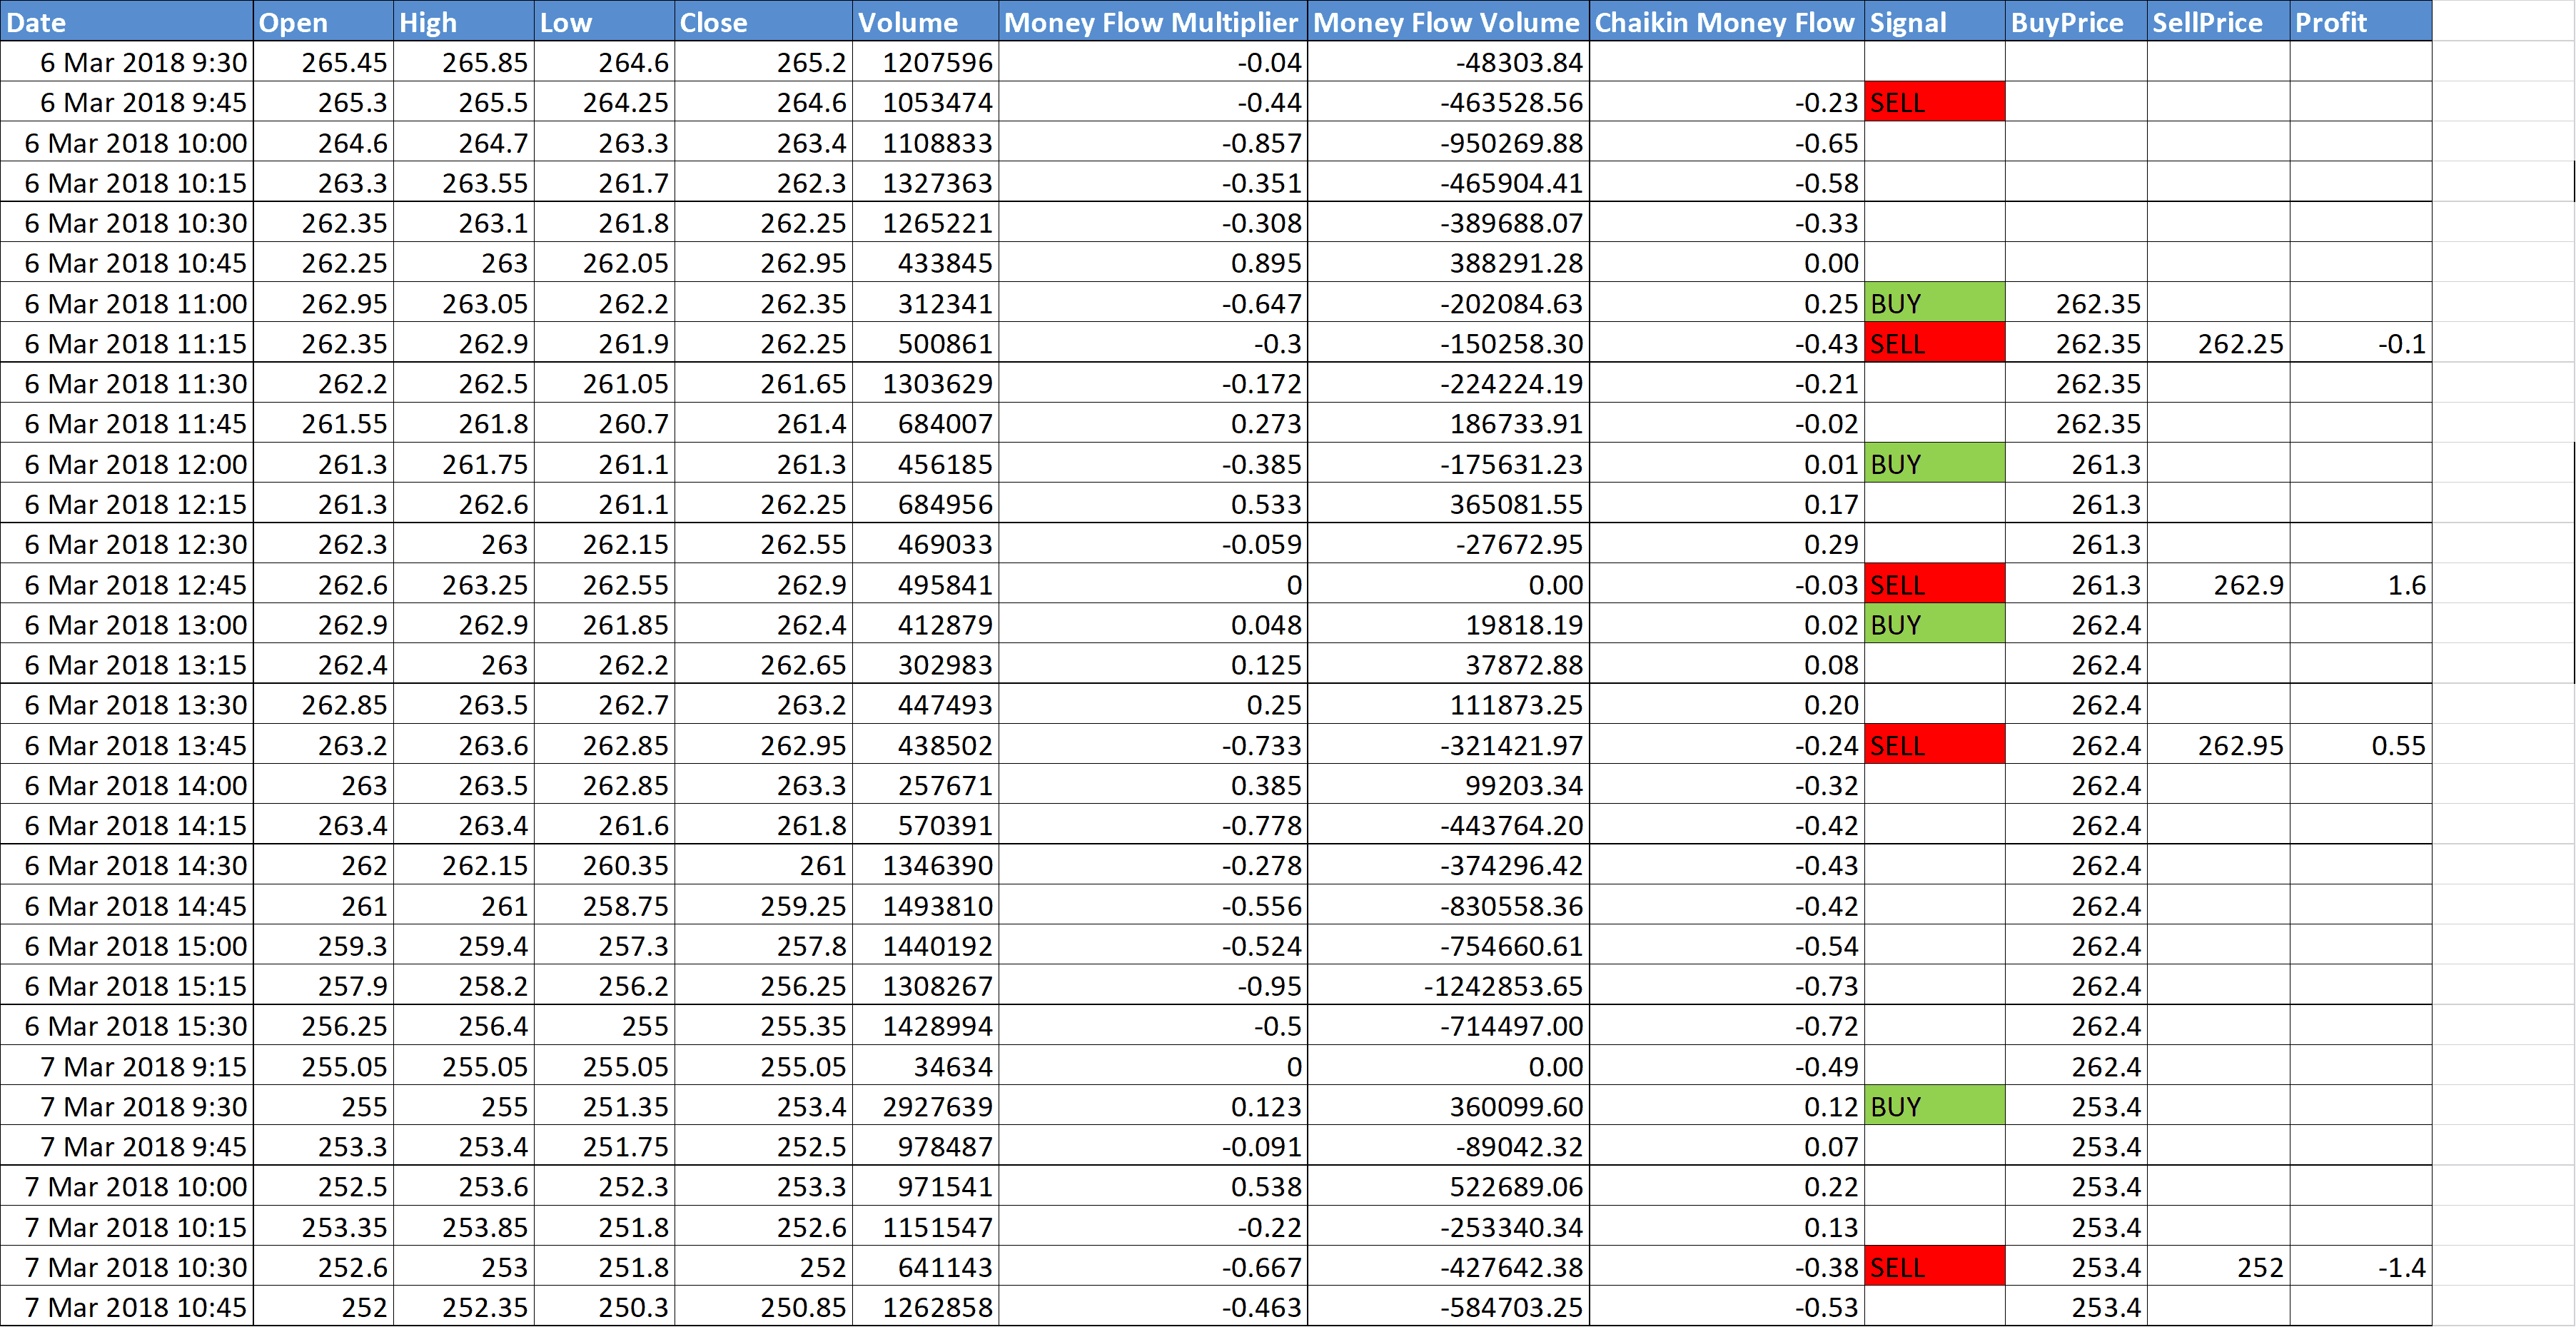
1. Derive the Money Flow Multiplier for each candle using the formula below:
Money Flow Multiplier = [(Close – Low) – (High – Close)] /(High – Low)
2. Compute the Money Flow Volume
Money Flow Volume = Money Flow Multiplier x Volume
3. Crunch the CMF for ‘n’ period using the formula below:
n Period CMF = n Period Sum of Money Flow Volume / n Period Sum of Volume
The usual choices for n are 20 and 21
Chaikin Money Flow values dance between -1 and +1. A positive shift or a leap from negative to positive is bullish. Conversely, a negative value or a slide from positive to negative is bearish.
This Excel sheet takes on the task of automating all the above calculation and interpretation steps.
Also Read: Golden Cross and Death Cross Trading Strategies
A Glimpse into Chaikin Money Flow Excel Sheet
Presenting an automated macro-enabled spreadsheet that deduces the CMF value and Buy/Sell signals for the entered symbol. It also autonomously tallies the profit/loss points based on these signals, requiring no manual input from you.
Take a gander at the screenshots below:
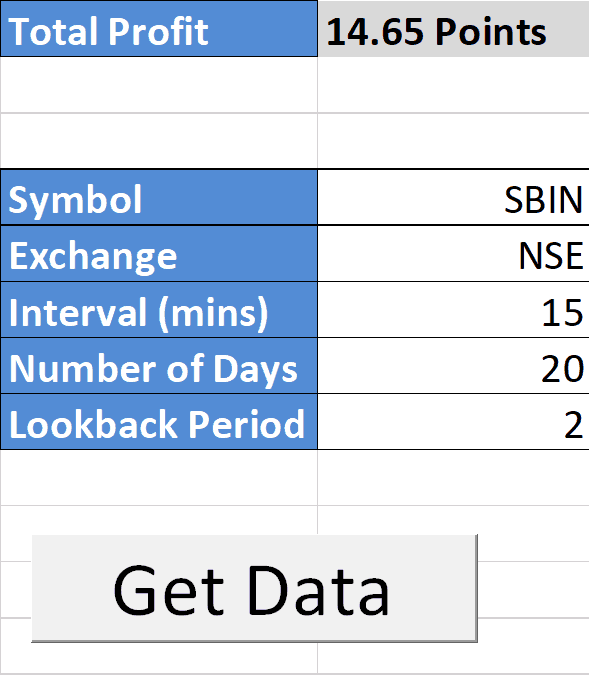
Guidelines on Using this Excel Sheet
Step 1: Snag the Excel file from the end of this post.
Step 2: Pop open this Excel file, ensuring your internet connection is active. Kindly permit if asked to enable Macros and Data connections.
Step 3: Fill in the Symbol Name, Exchange Name, Interval, Number of Days, and Lookback Period
Step 4: Press the Get Data button. Data will roll in automatically, and CMF values will get computed. You can fetch data for a max of 15 days with a minimum interval of 1 minute.
Step 5: Peek at the Signal column for Buy/Sell cues
Step 6: Check the Total Profit section to gauge the overall profit/loss for the desired period.
Snag the Chaikin Money Flow Excel Sheet
Hit the link below to download the CMF indicator excel sheet. We are open to your feedback or comments.